
Why aren't tide charts centered at mid tide?

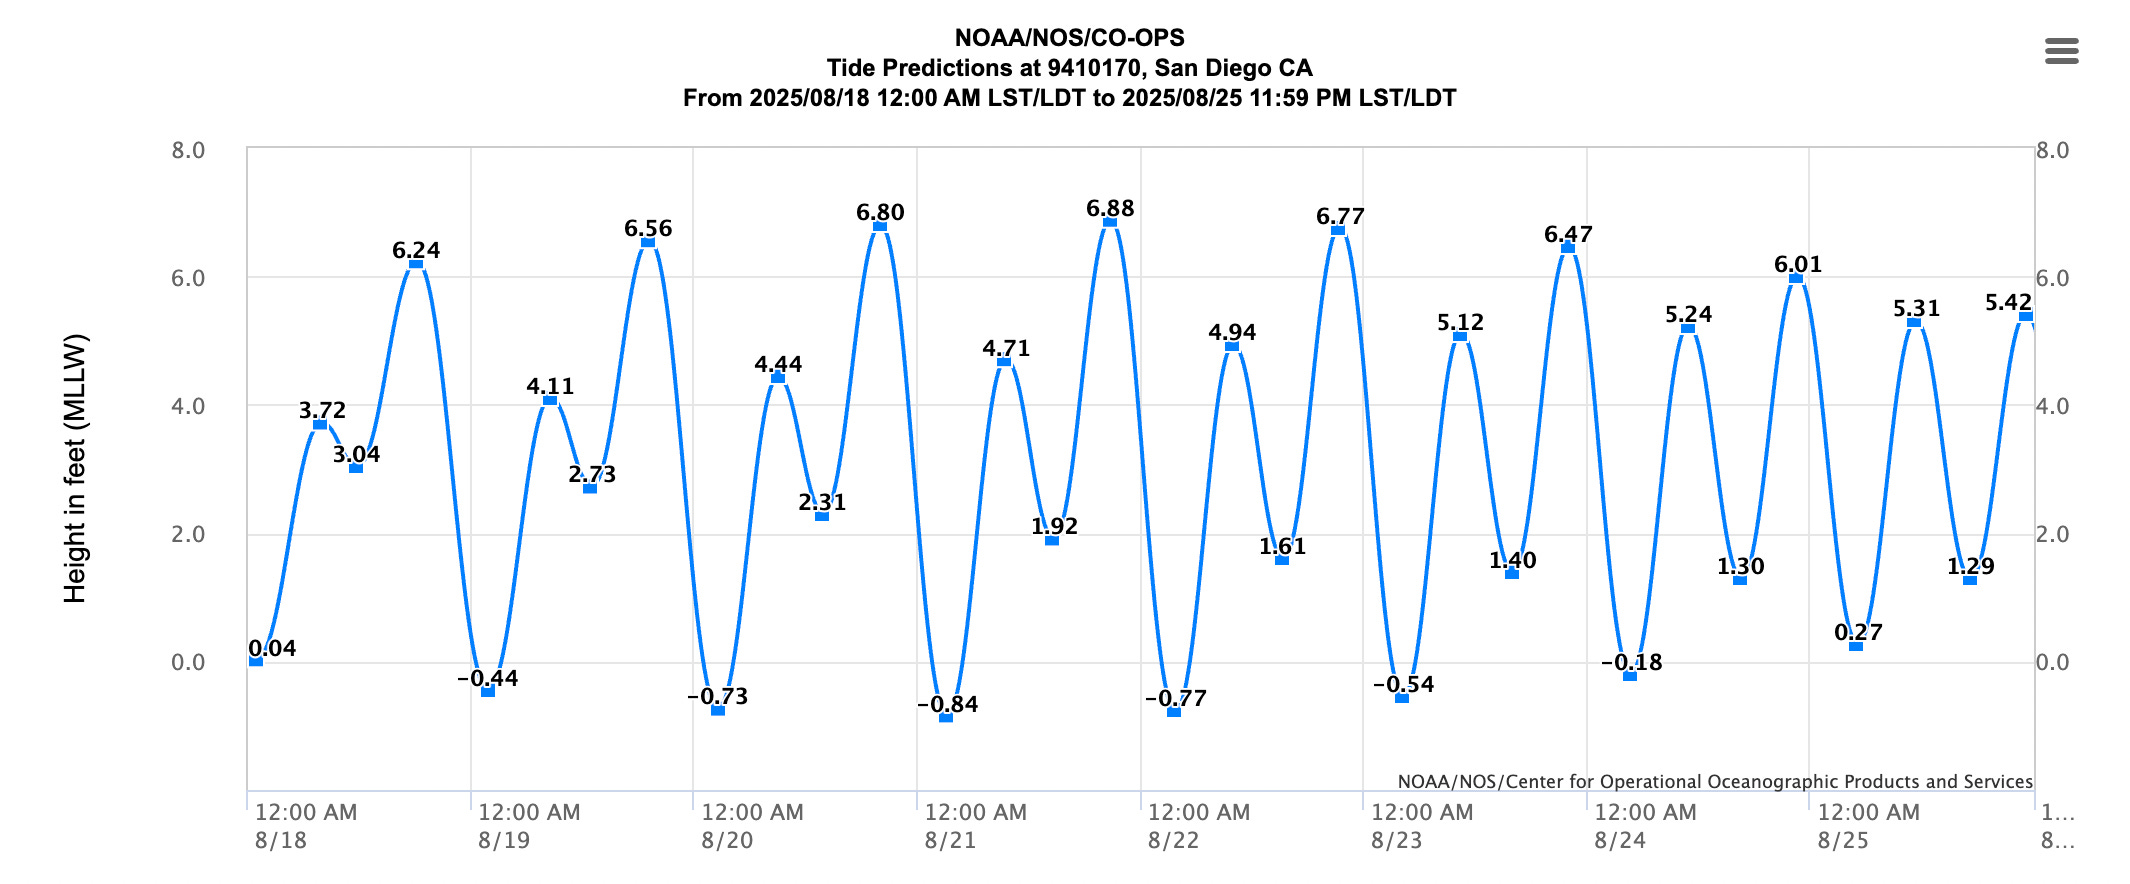
The fools down at Tide Charts Incorporated seem to have failed basic math. Instead of high tide at +3 feet and low tide at -3 feet, you'll see something like high tide at +6 feet and low tide at +0.3 feet. But it's actually a deliberate choice rooted in not running boats aground.
Tide charts use a baseline called Mean Lower Low Water, or MLLW. This represents the average of the lower of the two daily low tides over 19 years. That oddly specific timeframe captures a complete cycle of the major astronomical forces affecting tides.
Setting zero at the lowest predictable water level creates a safety buffer that originated from ship captains who needed to know minimum depths. When a chart shows 2 feet of water over a reef, you can be reasonably confident there's actually at least 2 feet there, even on the lowest tides. A ship drawing 10 feet of water needs the shallowest possible conditions, not the average. If charts were centered on mid-tide, a reading of zero could mean anything from 3 feet of water to completely exposed rocks.
Different regions use different tidal datums (a standard elevation defined by a certain phase of the tide) based on local characteristics. The East Coast typically uses Mean Low Water since their tides are more regular. The Great Lakes use a different system entirely since they don't experience significant astronomical tides. Each system optimizes for local conditions.
The choice of MLLW over Mean Low Water reflects the peculiarities of mixed semidiurnal tides - what we experience along most of the Pacific Coast. We typically see two high and two low tides per day, but they're often unequal. One low tide reaches significantly lower than the other, and it's this lower one that determines MLLW.
In San Diego, the difference between the two daily low tides can be substantial - sometimes over a foot. Using the average of both lows would create a disappearing safety margin when the lower low tide occurs. MLLW ensures that zero represents the most extreme low water conditions you're likely to encounter.

The 19-year averaging period captures the 18.6-year nodal cycle of the moon, during which lunar gravitational effects vary as the moon's orbit shifts relative to Earth's equator. This creates long-term patterns in tidal ranges that repeat over this timeframe. Shorter periods might miss these variations, while longer periods become less relevant for current conditions.
And even though we have relatively accurate forecasts out years, tide predictions aren't perfectly accurate - they don't account for weather or changes in temporary or baseline sea level. A strong onshore storm can raise water levels well above predicted highs, while persistent offshore winds can drop them below predicted lows. The 19-year average provides the baseline, but atmospheric conditions add variability.
The unbalanced tide swing represents decades of careful consideration about maritime safety and navigation. The system works, even if it doesn't look like the clean symmetry your brain craves. Or at least that mine does.
Further Reading: