
Why don't coastal currents follow the tides? Part 2

Last week, we introduced the idea that coastal trapped waves, not surface tides, drive the dominant tidal frequency currents in San Diego's inner shelf waters. But how exactly did we prove something like that?
The data for this project came from a heroic field effort by Scripps marine biologist Ed Parnell. Every six months for over seven years, Ed dove to 100 feet depth at three sites along the San Diego coastline to deploy, retrieve, and maintain Acoustic Doppler Current Profilers (ADCPs). For those unfamiliar with the Scripps facility, this means: getting gear prepped, walking down the pier, suiting up in full scuba gear, dropping a center console boat into the water using a 10-ton crane, climbing down the chain ladder to the boat, motoring to the sites, swimming down to the seafloor with heavy scientific equipment and lift bags, lining up the equipment on concrete pads, and ensuring everything works perfectly. Then heading back to the pier and reversing the whole process. All this before scrubbing off barnacles, downloading data, swapping batteries, sealing everything back up for redeployment, and doing the same thing tomorrow.
The challenges of maintaining scientific equipment underwater for seven years can't be overstated. Salt water corrodes everything, marine growth clogs sensors, and storms can shift or damage instruments. Ed's commitment to this routine created an unprecedented dataset that revealed patterns invisible to shorter studies.
Originally collecting the data for his own biological research, Ed was generous enough to share this unprecedented dataset with me and my former advisor, Geno Pawlak, who first made the connection that internal waves could be driving the coastal currents.
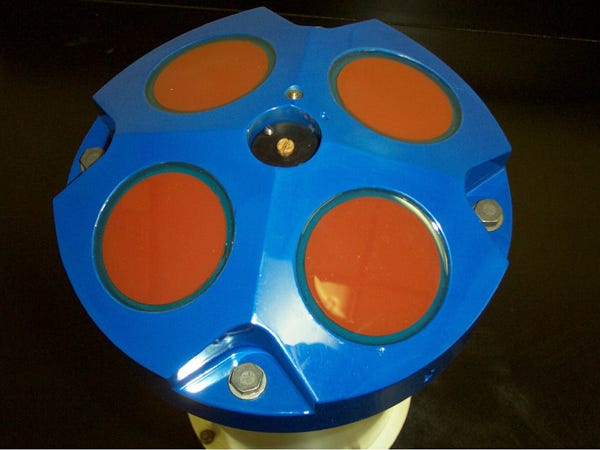
All this effort was focused on deploying and maintaining ADCPs - acoustic instruments that use sound waves to measure ocean currents at multiple depths simultaneously. The instrument sends out sound pulses that bounce off tiny particles in the water - marine life, kelp bits, and sediment. When these particles move with the current, they shift the sound frequency slightly, like how an ambulance siren changes pitch as it passes by.
By measuring these frequency shifts and knowing how long sound takes to travel specific distances, ADCPs can calculate water velocity at various depths throughout the water column. Since our instruments were mounted on the seafloor and pointed upward, we could resolve currents from near the bottom to almost the surface.
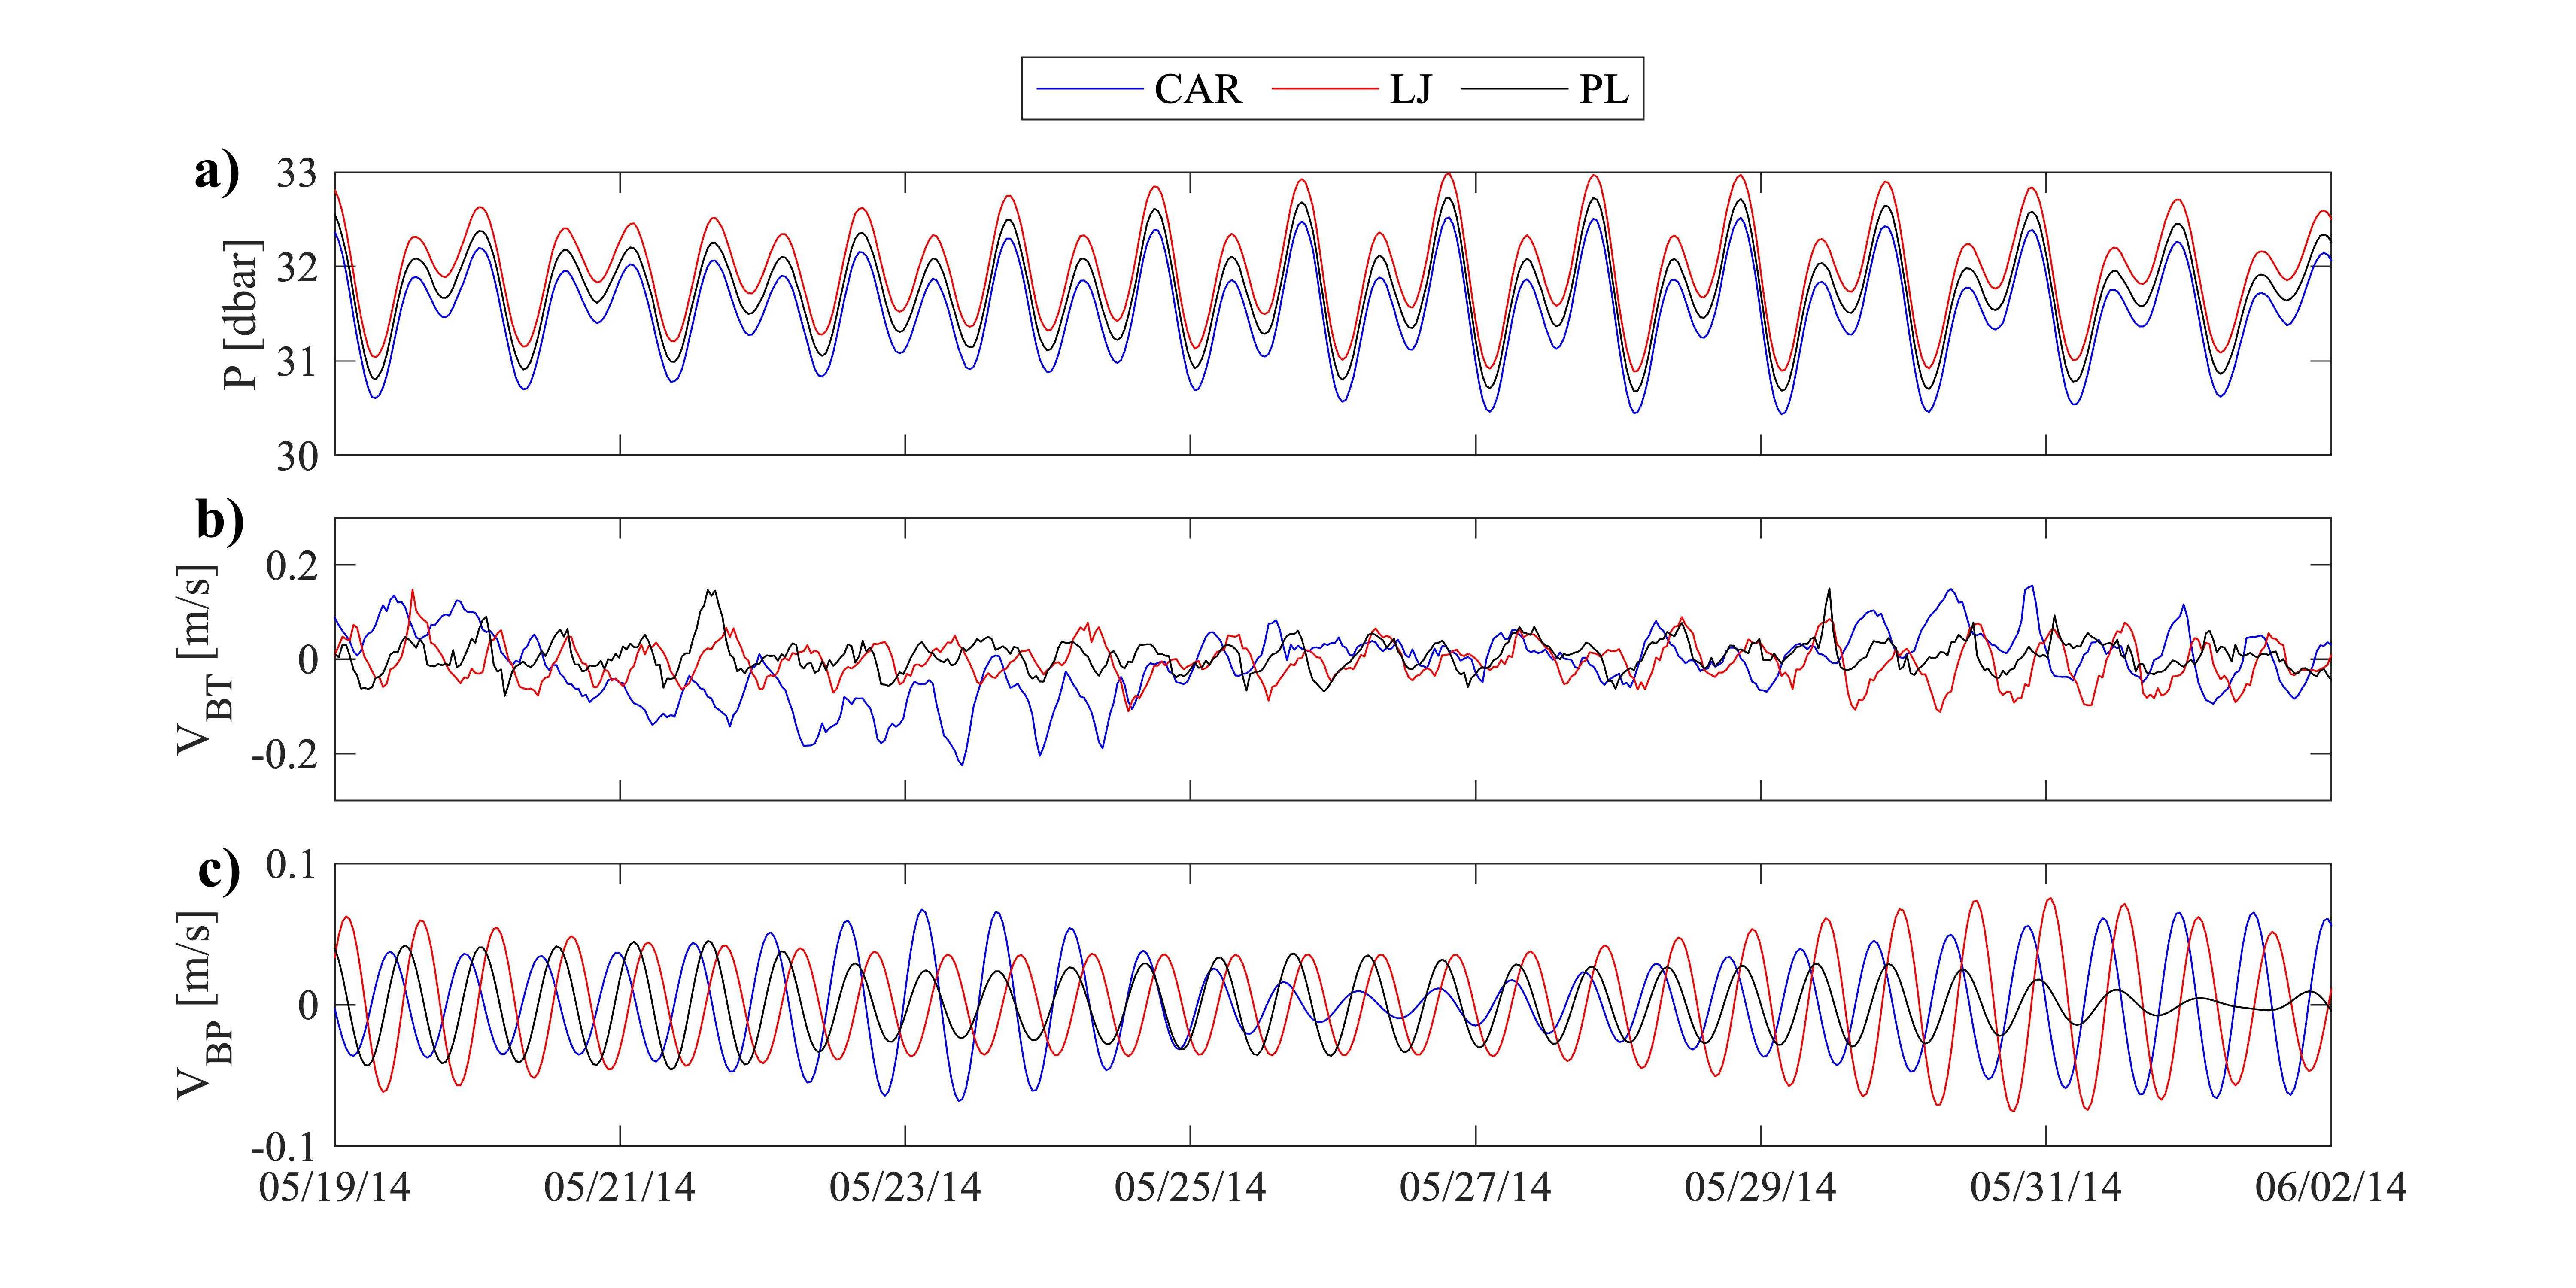
The three deployment sites span approximately 35 kilometers along the 33-meter depth contour, positioned at Point Loma, La Jolla, and Cardiff. This depth is a good representation of the inner shelf region. The La Jolla site proved particularly valuable due to its proximity to the Scripps submarine canyon, a massive underwater gorge that creates ideal conditions for generating internal waves.
Each ADCP also recorded pressure, allowing us to track tidal height variations, and temperature at the seafloor, revealing seasonal temperature cycles at depth. All of this data was collected in five-minute averages, continuously, for roughly seven years. That's over 36 million individual measurements per site, averaged into 730,000 measurements, per depth bin. All data included, that totals nearly 1.3 billion data points collected for the alongshore current.
For perspective on this dataset's value, most coastal current studies span weeks to months. Multi-year studies typically have gaps during winter storms or equipment failures, or are much lower resolution. This seven-year continuous record at three sites simultaneously represents a rare window into long-term coastal dynamics that reveals daily and seasonal patterns, interannual variability, and rare events that shorter studies miss entirely.
The data quality achieved through this sustained effort enabled analyses impossible with shorter records. We could separate signals that operate on different timescales, identify seasonal patterns in wave behavior, and quantify the relative importance of different physical processes. Most importantly, we were able to make a strong argument that the twice-daily current patterns previously attributed to surface tides actually result from coastal trapped waves.
Next week, we'll examine what this seven-year dataset revealed about the hidden world of coastal trapped waves and why this discovery changes our understanding of how coastal oceans work.
Further Reading:
My only introduction to beach physics was from talks at the 2010 rip current symposium in Miami. As a retired terrestrial botanist/bureaucrat (US Fish and Wildlife Service), Eurelian and Lagrangian mechanics were not in my head (nor for more legitimate participants: I got interested in beach lifeguarding thanks to being there). The complexities of beach currents were evident, along with the difficulties of studying them. As an ignorant outsider, the Parnell dataset looks like a marvel of technology, along with that hard work and, apparently, reliable funding.
Here on the Florida Atlantic coast, longshore currents are invariably wind driven, and pretty prevalent, normally gentle. National Weather Service has become prone to advise on them along with rip currents. So at western Newport Beach on June 1, the breeze was from the west but the longshore from the east, gently wanting you to visit Huntington. It made for an energy-conserving swim with lifeguard consent out through the persistent rip that he'd been gently moving people away from all day, exiting, and heading back near the next tower.