
How much of surfing is actually surfing?

We oceanographers love decomposing things. Hand us a dataset of ocean temperatures or current velocities, and we’ll start breaking it into orthogonal modes that explain progressively less variance. The technique is called Empirical Orthogonal Function analysis - EOF1 captures the dominant pattern, EOF2 the next most important, and so on down the line. Each mode is mathematically independent from the others. Applied to a surf session, the modes become activities, ranked by how much of your time they consume. This tool has dominated my research lately, so let’s see what we get.
Luckily, the data we need already exists. One study strapped GPS units and heart rate monitors to 39 recreational surfers across 60 sessions. Another filmed 42 heats during an international competition. A third analyzed 87 competition videos frame by frame. The time spent doing each activity lands in the same place across all three.
Across all studies, EOF1 is paddling, accounting for 47-51% of your session. Half the total time of any surf session, give or take a few percent, belongs to horizontal movement on your board. Paddling out, paddling for position, paddling for waves, paddling back after that ride, paddling for the first set wave, missing it, and paddling harder when the wave’s big brother catches you inside. This first mode dominates everything else.
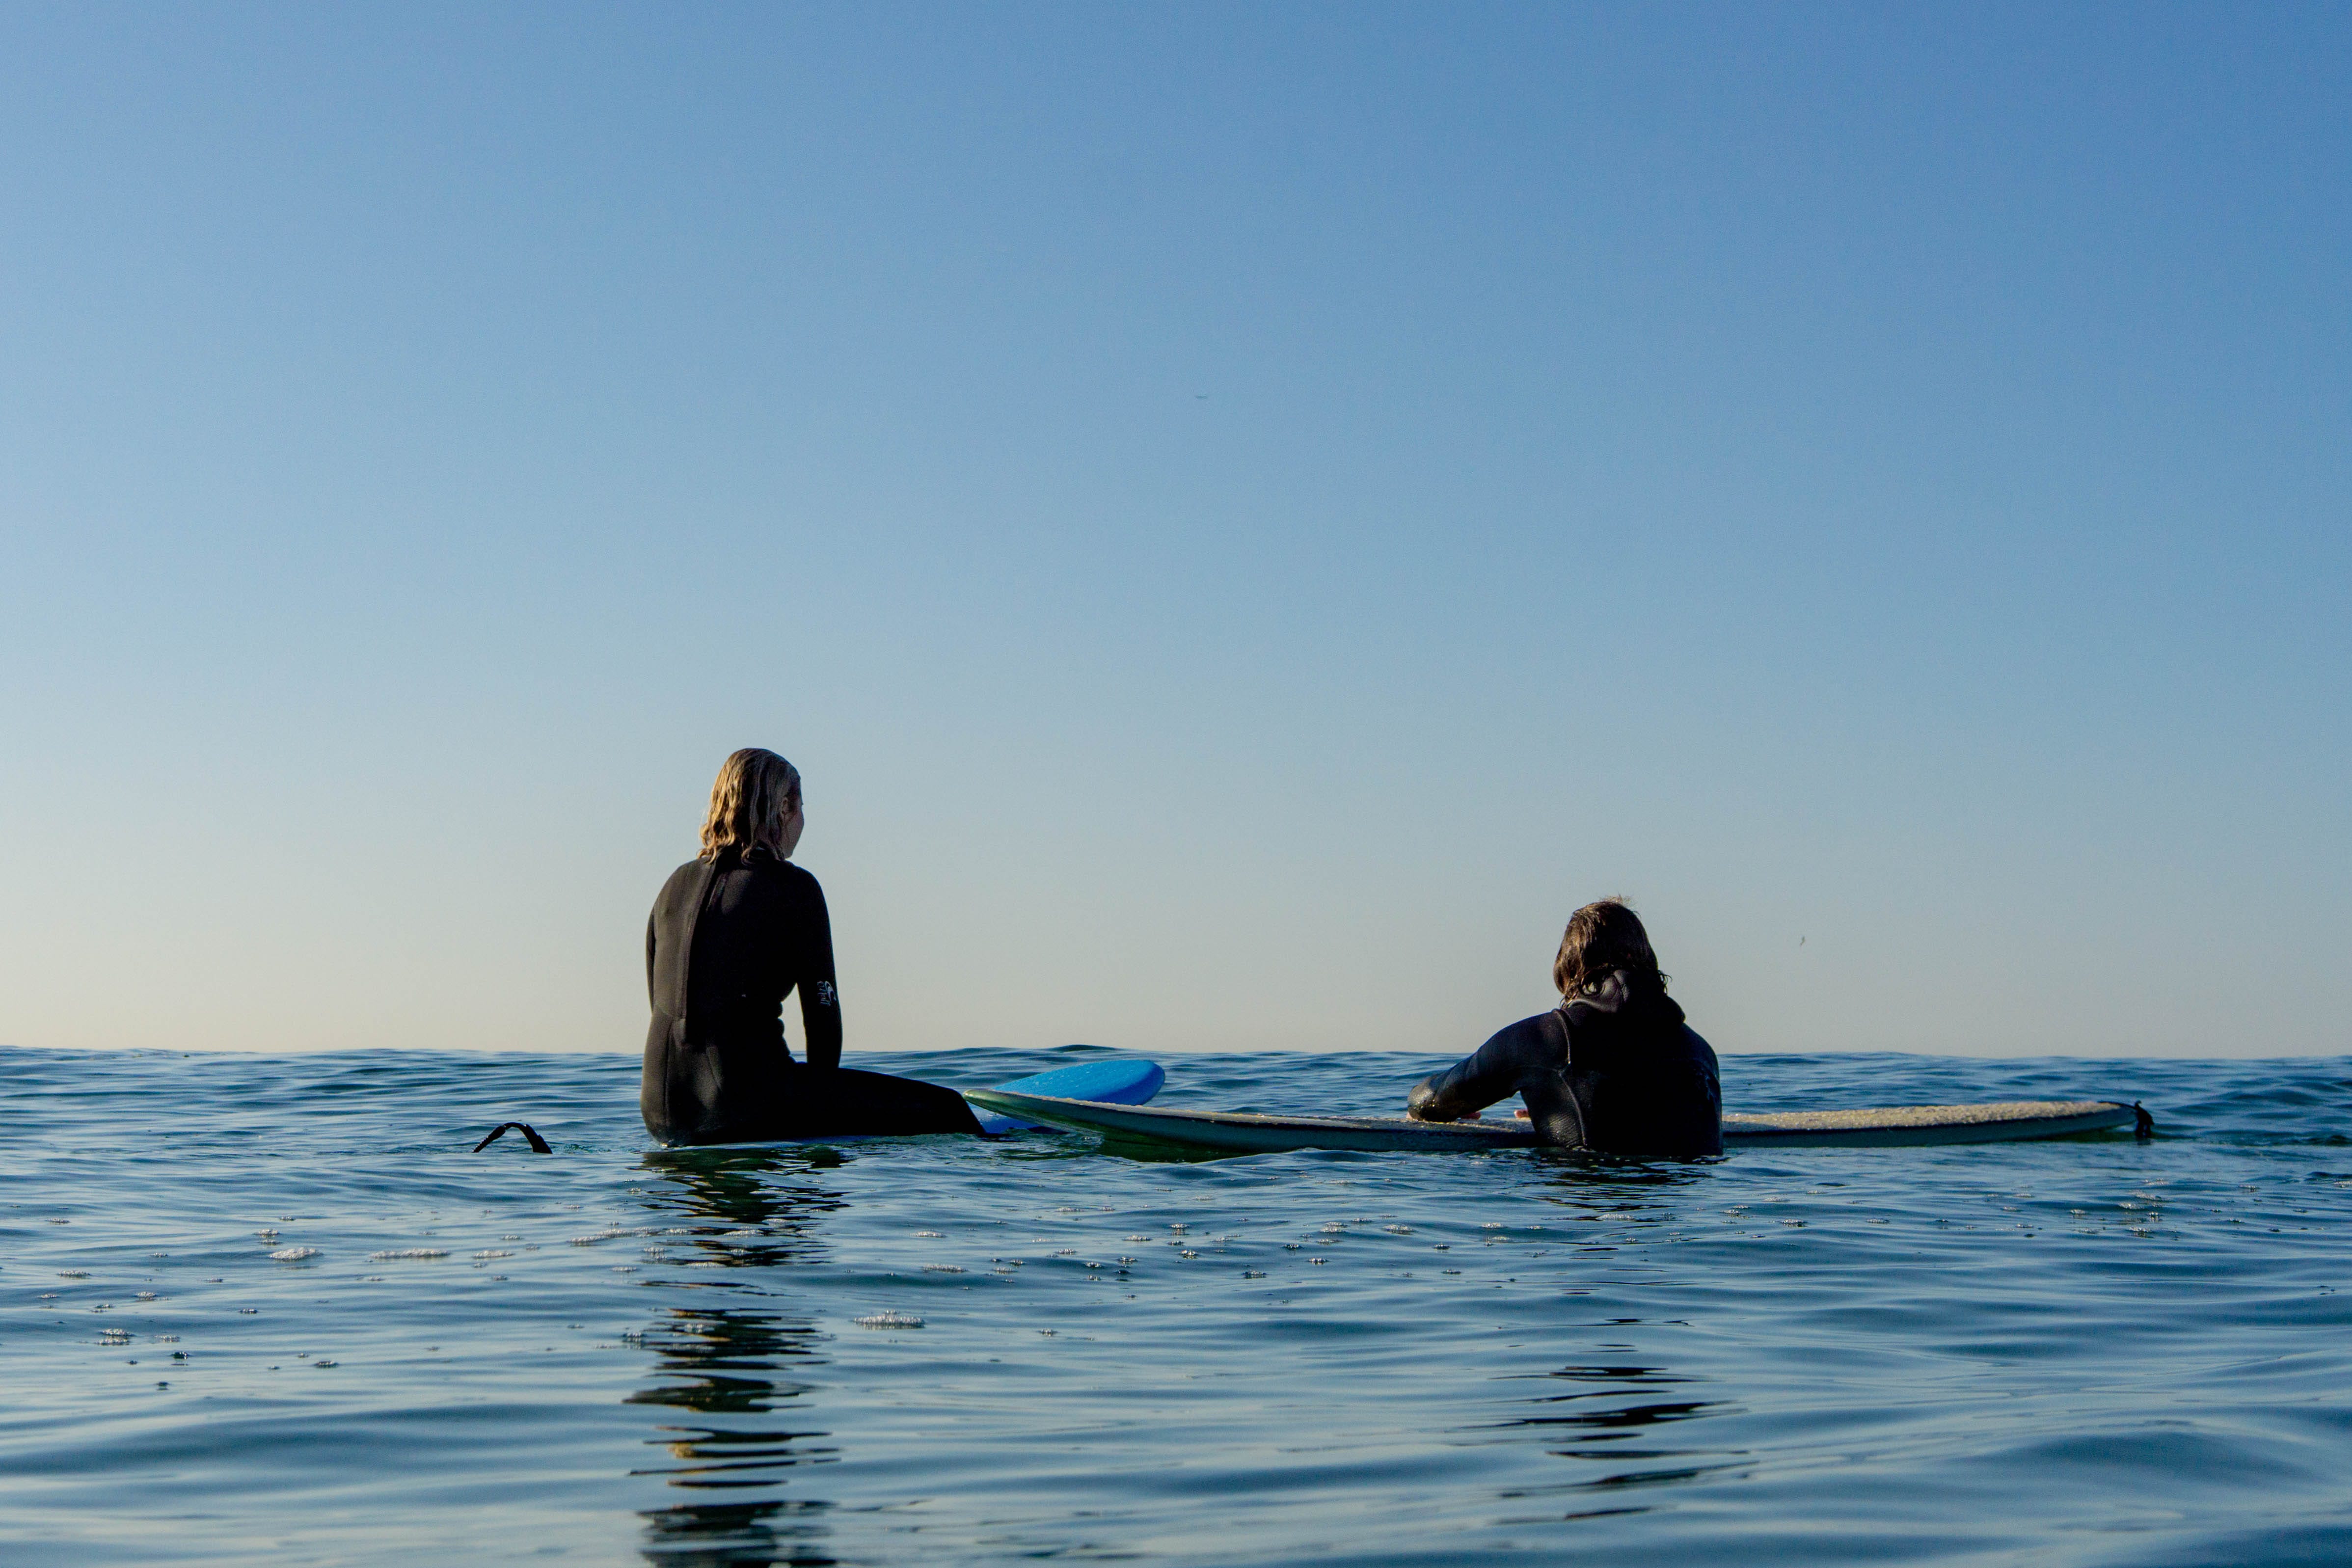
Waiting claims EOF2. Competitive surfers were stationary 42% of the time. Recreational surfers spent 41.6% sitting. The lulls between sets, the positioning adjustments, the horizon-watching - all of it lives in this second mode. And it’s orthogonal to paddling in the strict sense: you’re either moving yourself or you’re not. The two modes don’t overlap.
Between EOF1 and EOF2, roughly 90% of a surf session is accounted for. Most of what makes surfing worth doing - the drops, the turns, stuffing closeouts - gets crammed into the remaining 10%. The first two modes are just the logistics of being in the ocean on a flotation device. Bummer.
Wave riding shows up as EOF3, explaining somewhere between 3-8% of total session time. Recreational surfers averaged 8.1%. Competitors managed 3.7%. The whole point of paddling and waiting, the reason any of us are out there, barely shows up in the decomposition.
EOF4 and beyond capture what’s left: duck diving, board recovery, untangling from kelp, the post-wipeout scramble. Each mode explains less than the one before it. Miscellaneous activities accounted for 2-9% across the studies, depending on conditions. These higher modes add some texture to a session but don’t meaningfully shift its structure.
Even though these three studies are aligned, the decomposition isn’t necessarily fixed. Conditions and skill level shift the relative importance of each mode. Crowded lineups inflate EOF2 as you wait longer between opportunities. Bigger waves with longer paddles back out push EOF1 higher. Better surfers show lower physiological intensity for the same output - their EOF1 costs less metabolically, leaving more for EOF3. Wave pools flip things around, shrinking paddling and waiting while wave riding expands to fill most of the session. Same modes, different weightings.
But what if we push it even further? What about the time suiting up, stripping down, driving to breaks all around town? How about the dreaming of waves between swells or the recalling of your best wave to people that you don’t know that well? All of these take up significant amounts of your surfing-related time and push the actual wave riding down towards one percent. But man is that a good one percent.
Further Reading: