

Two years ago this week, the first of these went out. In the time it took to write and send 104 of these, the ocean absorbed close to 40 zettajoules of heat. Since that is a meaningless number and a unit I have never heard of before this, let’s use the world’s nuclear arsenal as our units. Setting off every nuclear warhead on the planet at once, all twelve thousand or so of them, is about how much energy is absorbed by the ocean every few hours. In the two years since Science of Surfing has begun, the ocean has taken roughly 3000 times over the world’s nuclear stash.
The arsenal itself has warmed the ocean by nothing you could measure, which is the good news. The heat came from the sun. In the instrumental record, 2024 was the warmest the global sea surface has ever been.
In 2025, La Niña spread across the Pacific and pulled the surface back down, about a tenth of a degree below 2024, taking it to the third-warmest year instead of first. Underneath, the heat content of the upper two kilometers kept climbing to a new record.
In February 2026, NOAA changed how it defines El Niño. The old index compared a patch of the tropical Pacific to a fixed thirty-year average, but the whole tropical ocean has warmed so far that the fixed average kept flagging ordinary heat as an event. The new one subtracts the background warming first and measures only what stands above it. When you have to redefine the baseline to keep a word meaningful, that tells you something about the baseline.
Warm water is bigger water, and a warmer ocean is a taller one. In 2024 the global sea surface rose 0.59 centimeters against an expected 0.43, and for once the reason was mostly expansion rather than melt. In a normal year about two-thirds of the rise is meltwater off the ice sheets; in 2024 about two-thirds was the ocean swelling as it warmed and became less dense.
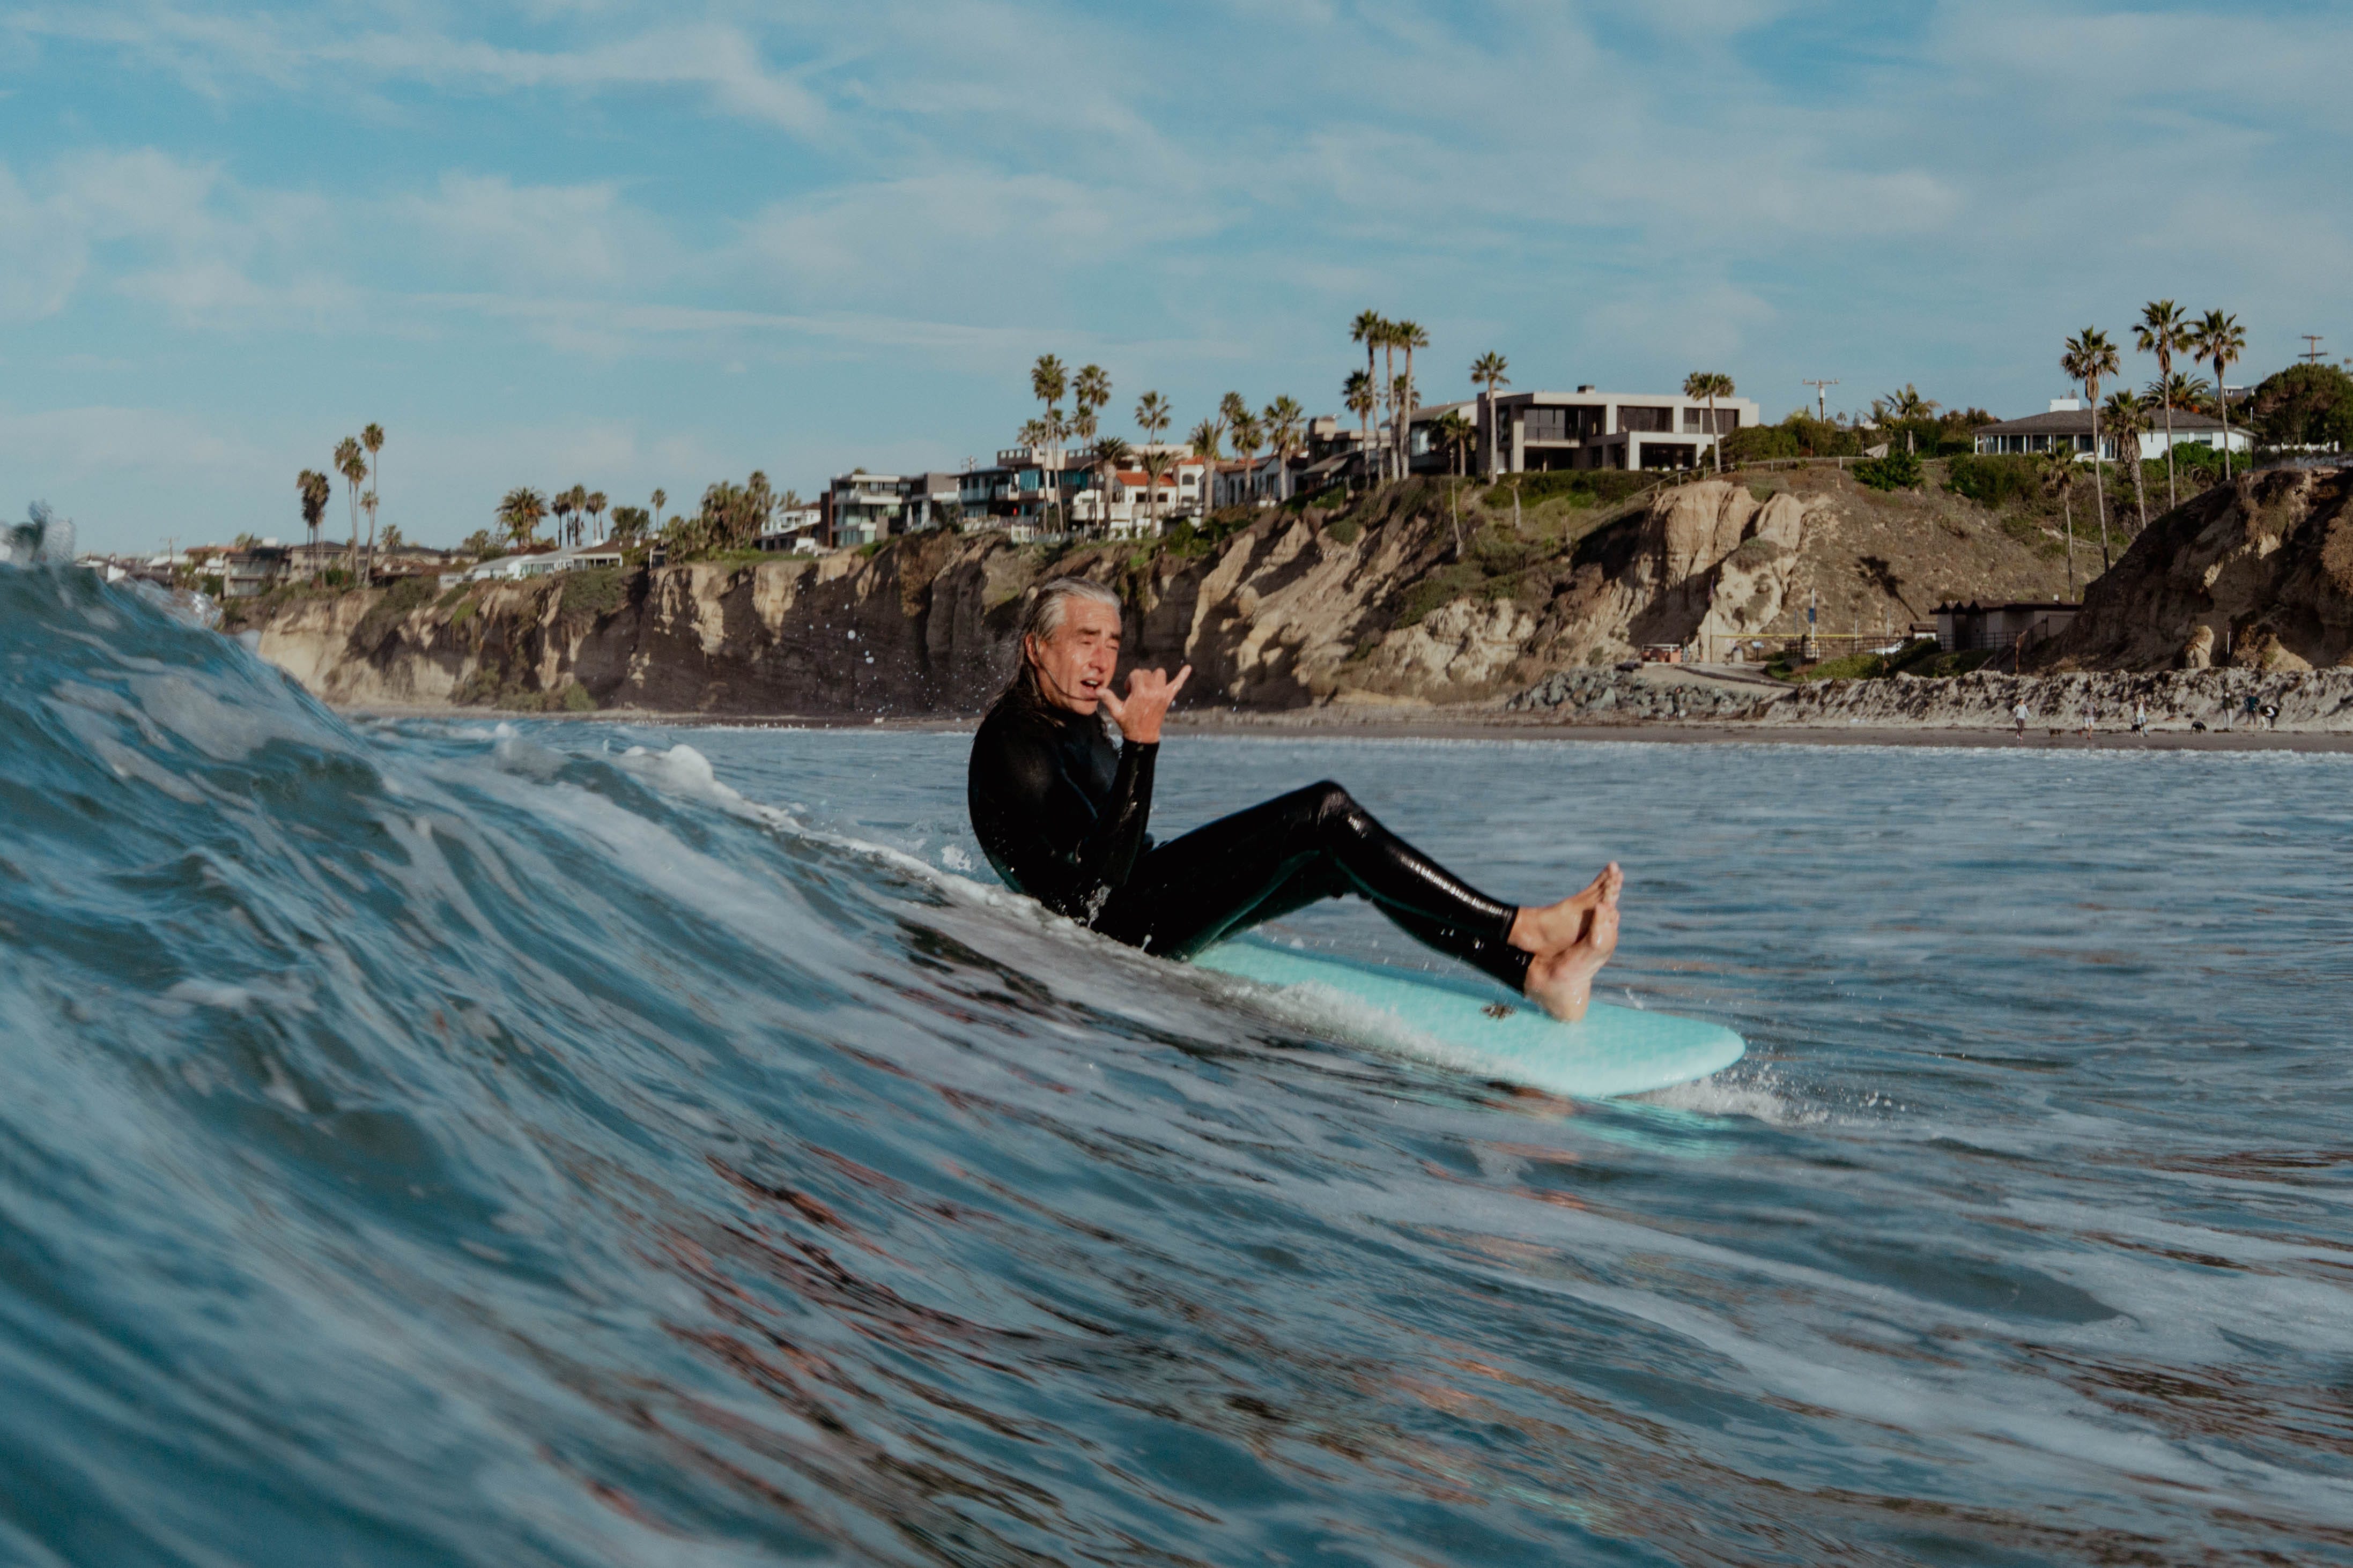
Interestingly, 2025 sea level barely budged, a mere 0.08 centimeters. The same La Niña that cooled the surface dumped its rain over the Amazon and a few other basins, and for a few months the land held onto water that would otherwise have been in the sea.
Cumulatively over the two years, the ocean grew by about 2,400 cubic kilometers. Poured over California, that is a layer almost six meters deep, coast to state line.
Down at the bottom of the planet, the ocean did the opposite of what was generally forecasted. The projections all had the Southern Ocean surface freshening as ice melted into it. Instead, since about 2015, the surface south of 50 degrees has been getting saltier. Alessandro Silvano and colleagues laid this out in PNAS this year, pairing satellite salinity with float measurements, and over that same stretch the Southern Ocean has shed sea ice on the order of the area of Greenland.
A hole in the ice near Maud Rise reopened around the same time, the first time it has done that since the 1970s, which is tied to the same saltier, less layered surface. This is the part that got mangled in the press as an ocean current reversing, essentially the plot of the movie “The Day After Tomorrow.” No current reversed. A decades-long freshening trend reversed, which is a different and much less impactful sentence. The saltier surface mixes more easily, letting heat from below reach the ice from underneath.
The Antarctic Circumpolar Current runs about 173 Sverdrups through Drake Passage, a Sverdrup being a million cubic meters a second, which works out to something like 10 million cubic kilometers of water shoved past a single point every two years. Putting the two numbers side by side: the entire two-year rise in global sea level, all 2,400 cubic kilometers of it, would slide through Drake Passage in under four hours.
The coolest thing the ocean did in these two years, in my opinion, it did on December 21, 2024. A storm in the northwest Pacific threw up a sea state so large that the SWOT satellite, passing overhead, measured a significant wave height of 19.7 meters. That is the largest wave height ever measured from orbit in 34 years of satellite altimetry, past the previous record set in 2011. Fabrice Ardhuin and colleagues reported it in PNAS, and from those numbers the biggest individual waves in the storm were likely over 35 meters, taller than a ten-story building.
The storm didn’t have a name, because storms in that corner of the Pacific don’t get them, so the scientists named it themselves. They called it Eddie, because the swell it made ran the Eddie Aikau at Waimea Bay the next day. The day after that, the same swell lit up Mavericks for what people are still calling one of the best days that wave has ever produced.
SWOT and the modelers tracked it radiating out for 24,000 kilometers, running south down the eastern Pacific, slipping through the gap at Drake Passage, and curling up into the tropical Atlantic more than two weeks after the storm that made it had already died. This wave jumped oceans.
On June 11, 2026, NOAA named a new El Niño and gave it better than even odds of turning strong by fall. El Niño winters tend to drag the North Pacific storm track south toward California, which usually means more swell, and more sand pulled off the beaches by spring. This one might do all of that. With all of the surprises these past years, who knows what’s in store for us in the next two.
Thank you for two years.
Further Reading: