

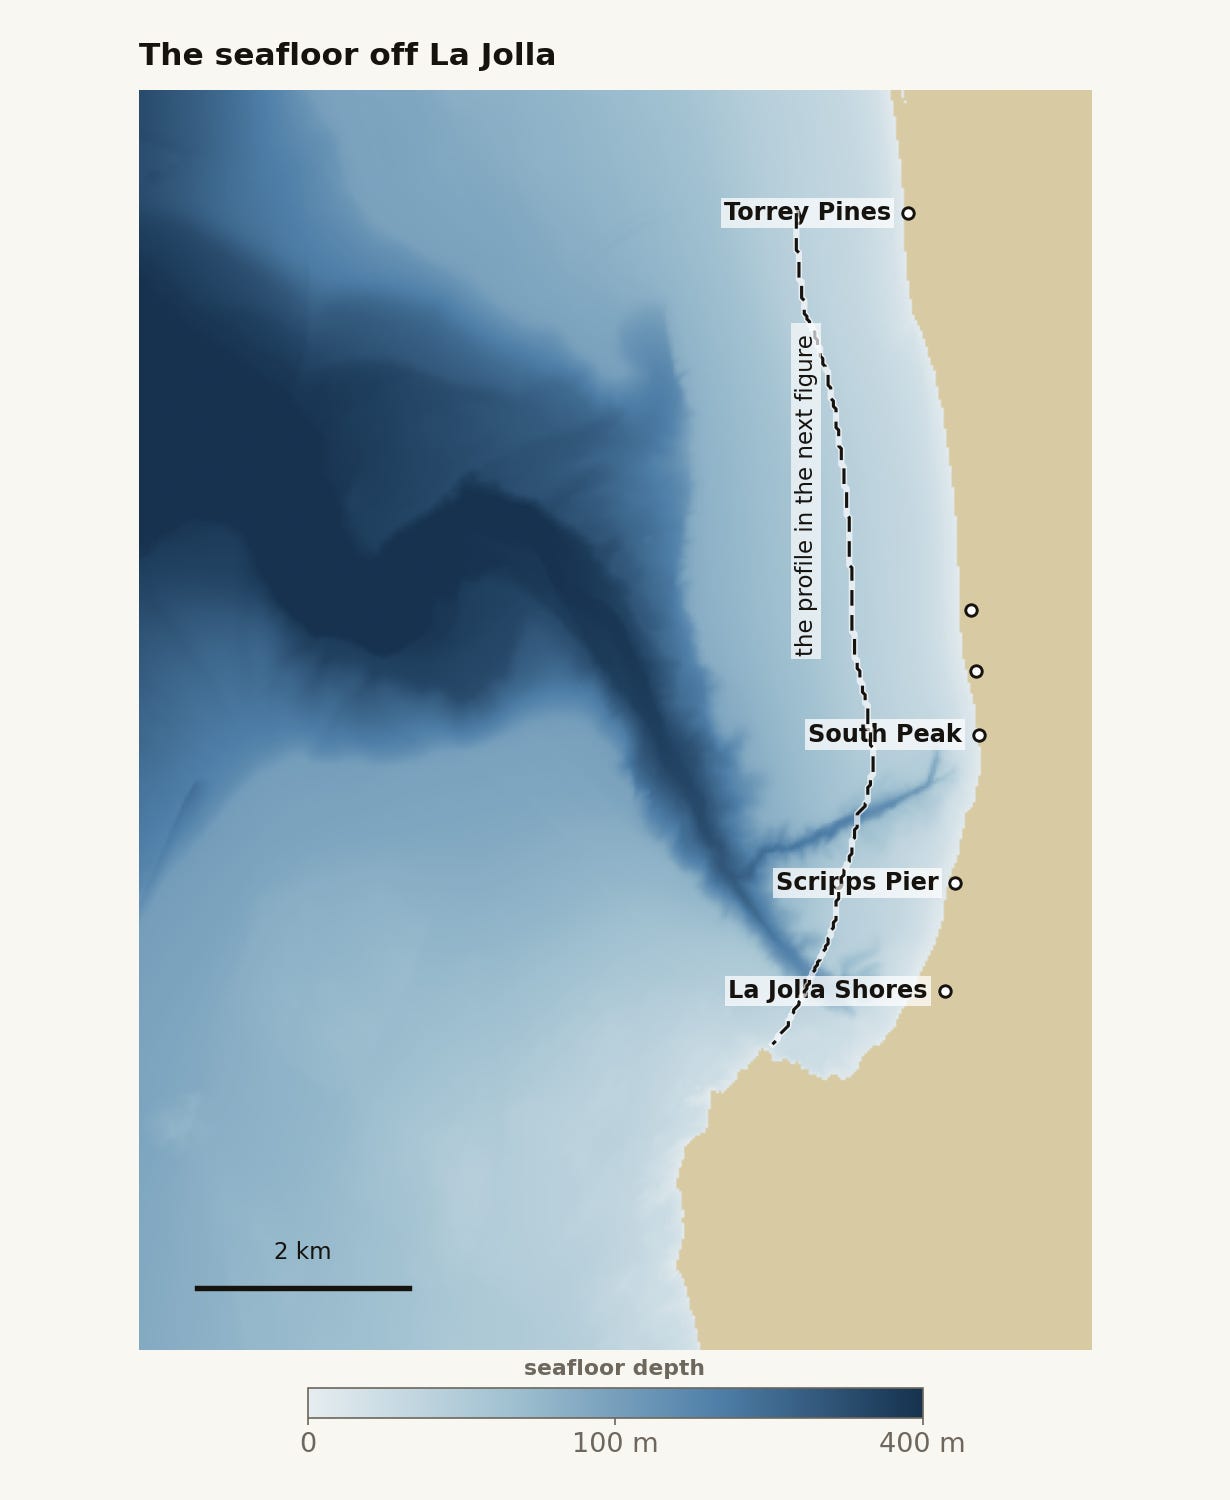
Black’s Beach holds the reputation as one of the biggest and most consistent waves in San Diego. The explanation is the submarine canyon system just offshore, the Scripps and La Jolla canyons.
This piece is about measuring how that canyon affects the swell that gets to Black’s. How much of Black’s is actually the canyon, which swells it works on, where the extra energy comes from, and what breaks have their energy sapped by it.
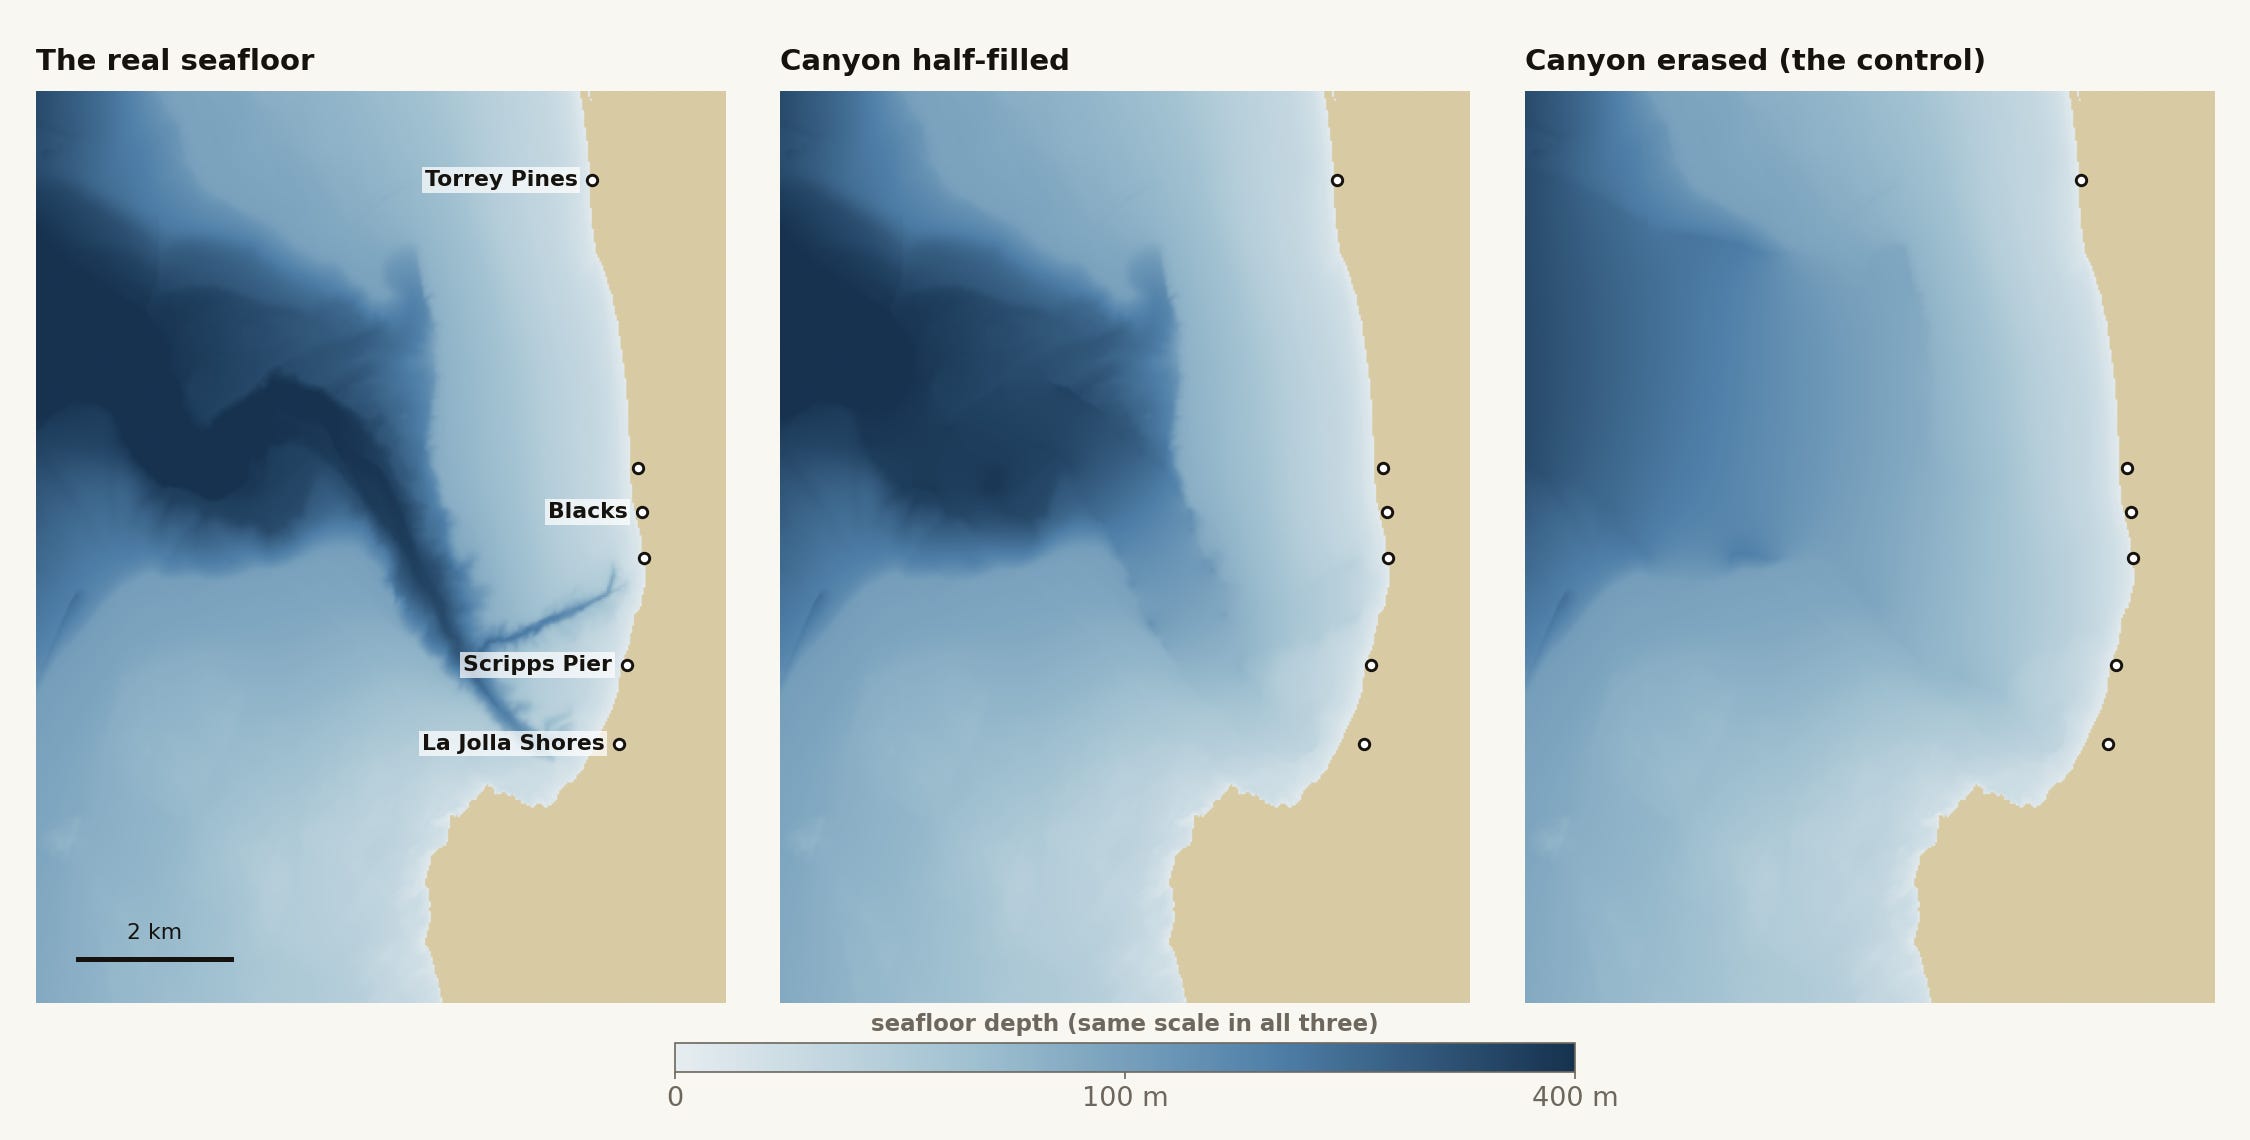
In this experiment, I use an open-source wave model applied to the local bathymetry. Celeris is a GPU solver fast enough to simulate every individual wave in a sea state on my laptop. I ran a swell over the real bathymetry, then ran the identical swell again over a seafloor with the canyon smoothed away. Any difference in how the swell arrives at the break between those two oceans is therefore the canyon’s doing. I ran twenty swells this way, four periods from 14 to 20 seconds across five directions from due south to west-northwest, spanning the window this stretch of coast receives.
This is the third piece in the First Order series, one question surfers have, answered in layers you can drag. The interactive map runs all twenty comparisons over the real seafloor, with breaks from Torrey Pines to Windansea marked: open the explorer →
Zeroth order: a plain shelf
On a featureless shelf the seafloor treats every beach the same. We have covered refraction before: waves feel bottom, slow down, and turn toward shore, and on a plain shelf that turning is even, so every stretch of sand receives the same wave the same way. In this picture two beaches three kilometers apart should be near-identical. Along most of this county’s sand they are, which is exactly what makes the exception worth an article.
First order: a canyon is a lens for waves
A kilometer off the sand, this shelf holds a remarkably steady twenty meters of water. Follow that line seven kilometers from La Jolla Shores to Torrey Pines and the bottom barely moves, except twice. Directly off the Shores, and again just north of Scripps Pier, the floor falls out to more than 120 meters: the two heads of the La Jolla and Scripps submarine canyons, each just a few hundred meters across.
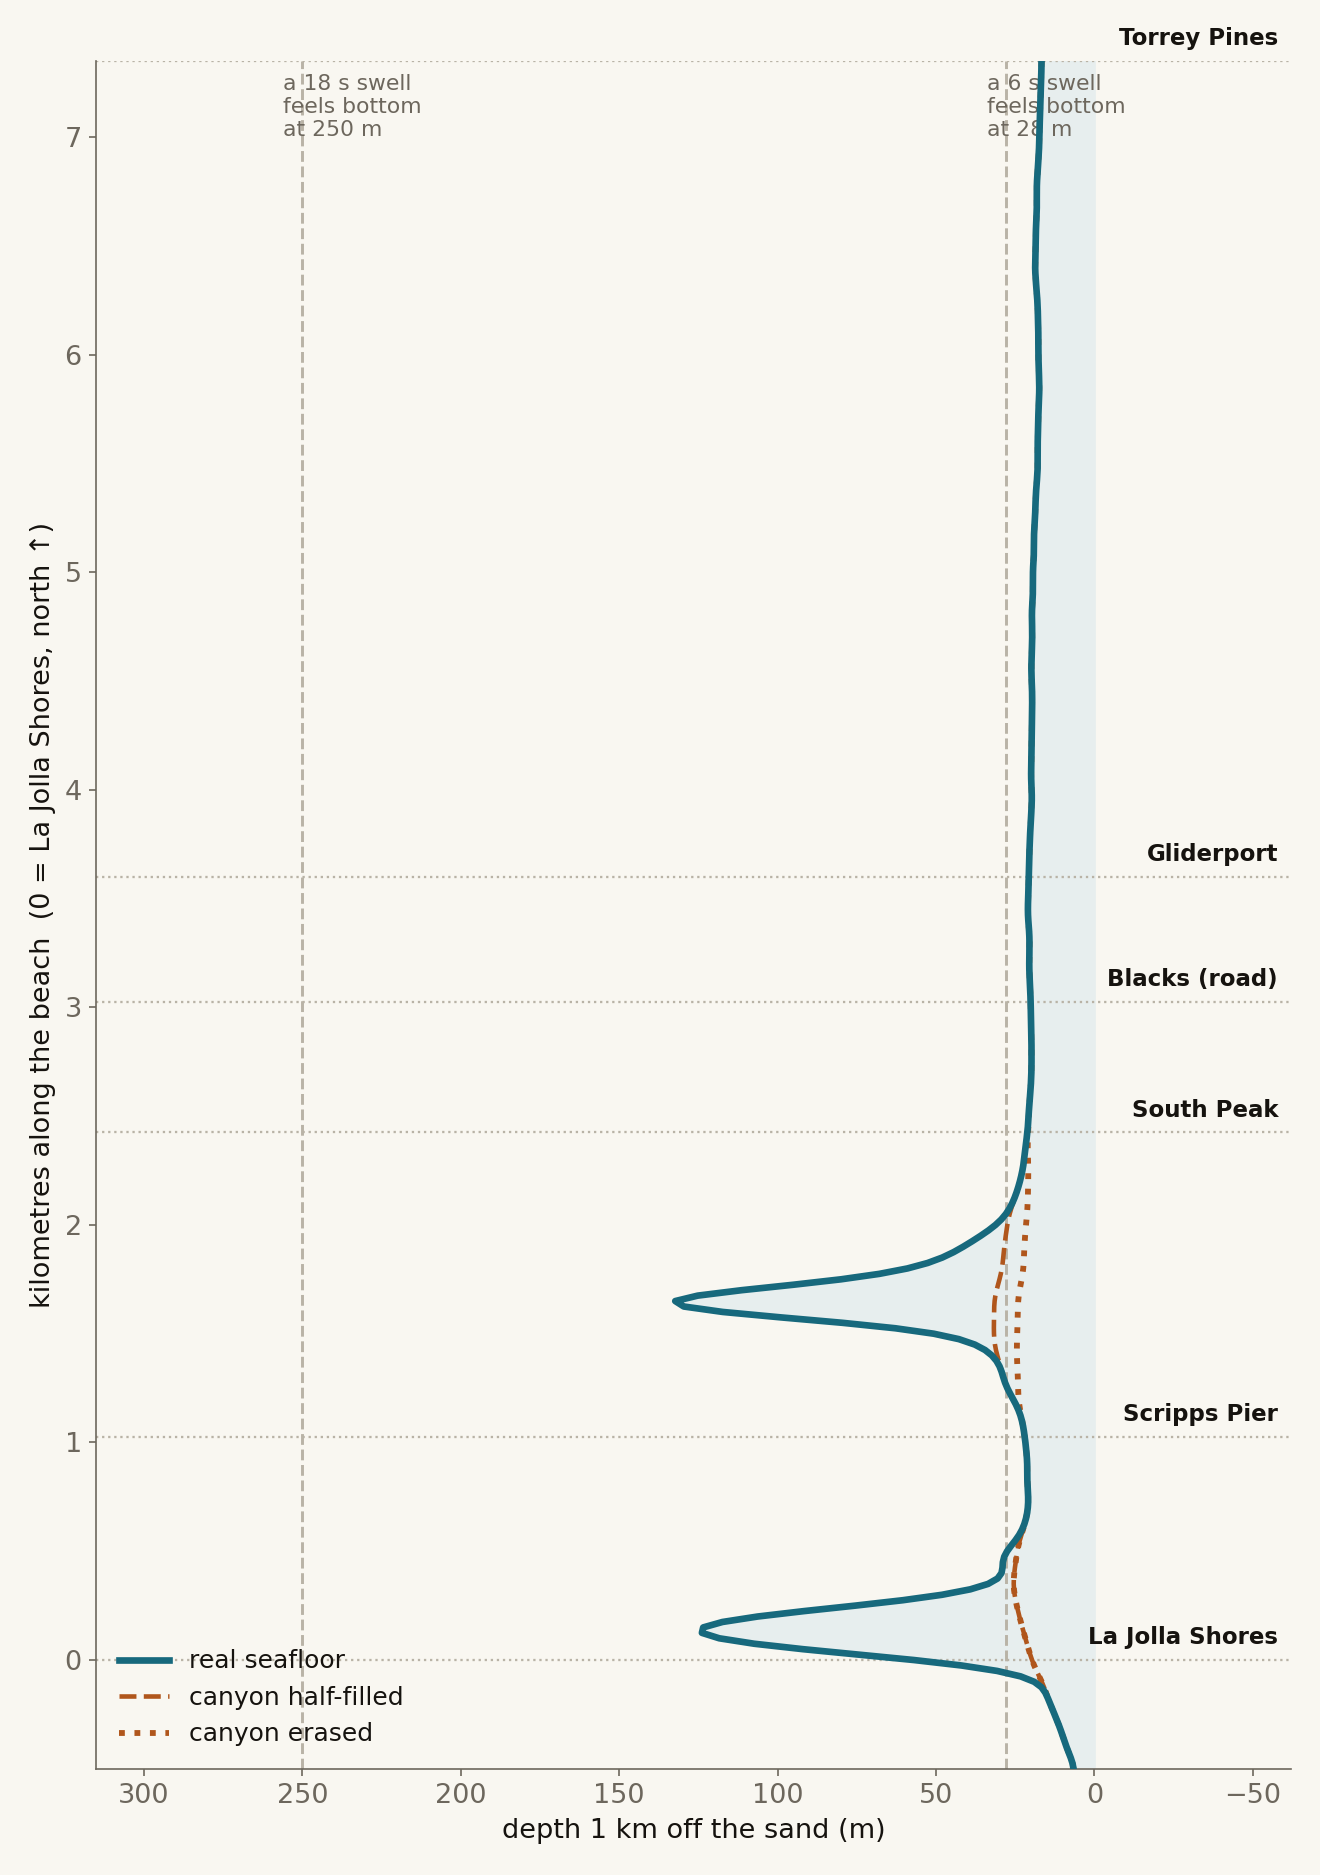
A wave only feels the seafloor once the water is shallower than about half its wavelength. For a 6 second windswell that is 28 meters, so short-period chop skims over this entire shelf, canyon and all, without feeling much of anything. An 18 second groundswell feels bottom at 250 meters, and thus the whole gash is in play on its way in. The canyon does not exist for windswell, but it exists for groundswell. The longer the period, the more of the canyon exists.
Shallow water slows waves down. The stretch of a crest passing over the deep slot keeps its speed while the parts on either side drag on the shelf, so the crest bows and the wave’s energy paths, the rays, bend away from the deep. Behind the canyon, the rays spread apart, and just outside its rims, they crowd together. Crowded rays mean the same energy squeezed into less coastline, so bigger surf. Spread rays mean the opposite, weaker surf. A trench in the shelf is a lens, and like any lens, it cannot brighten one spot without darkening another.
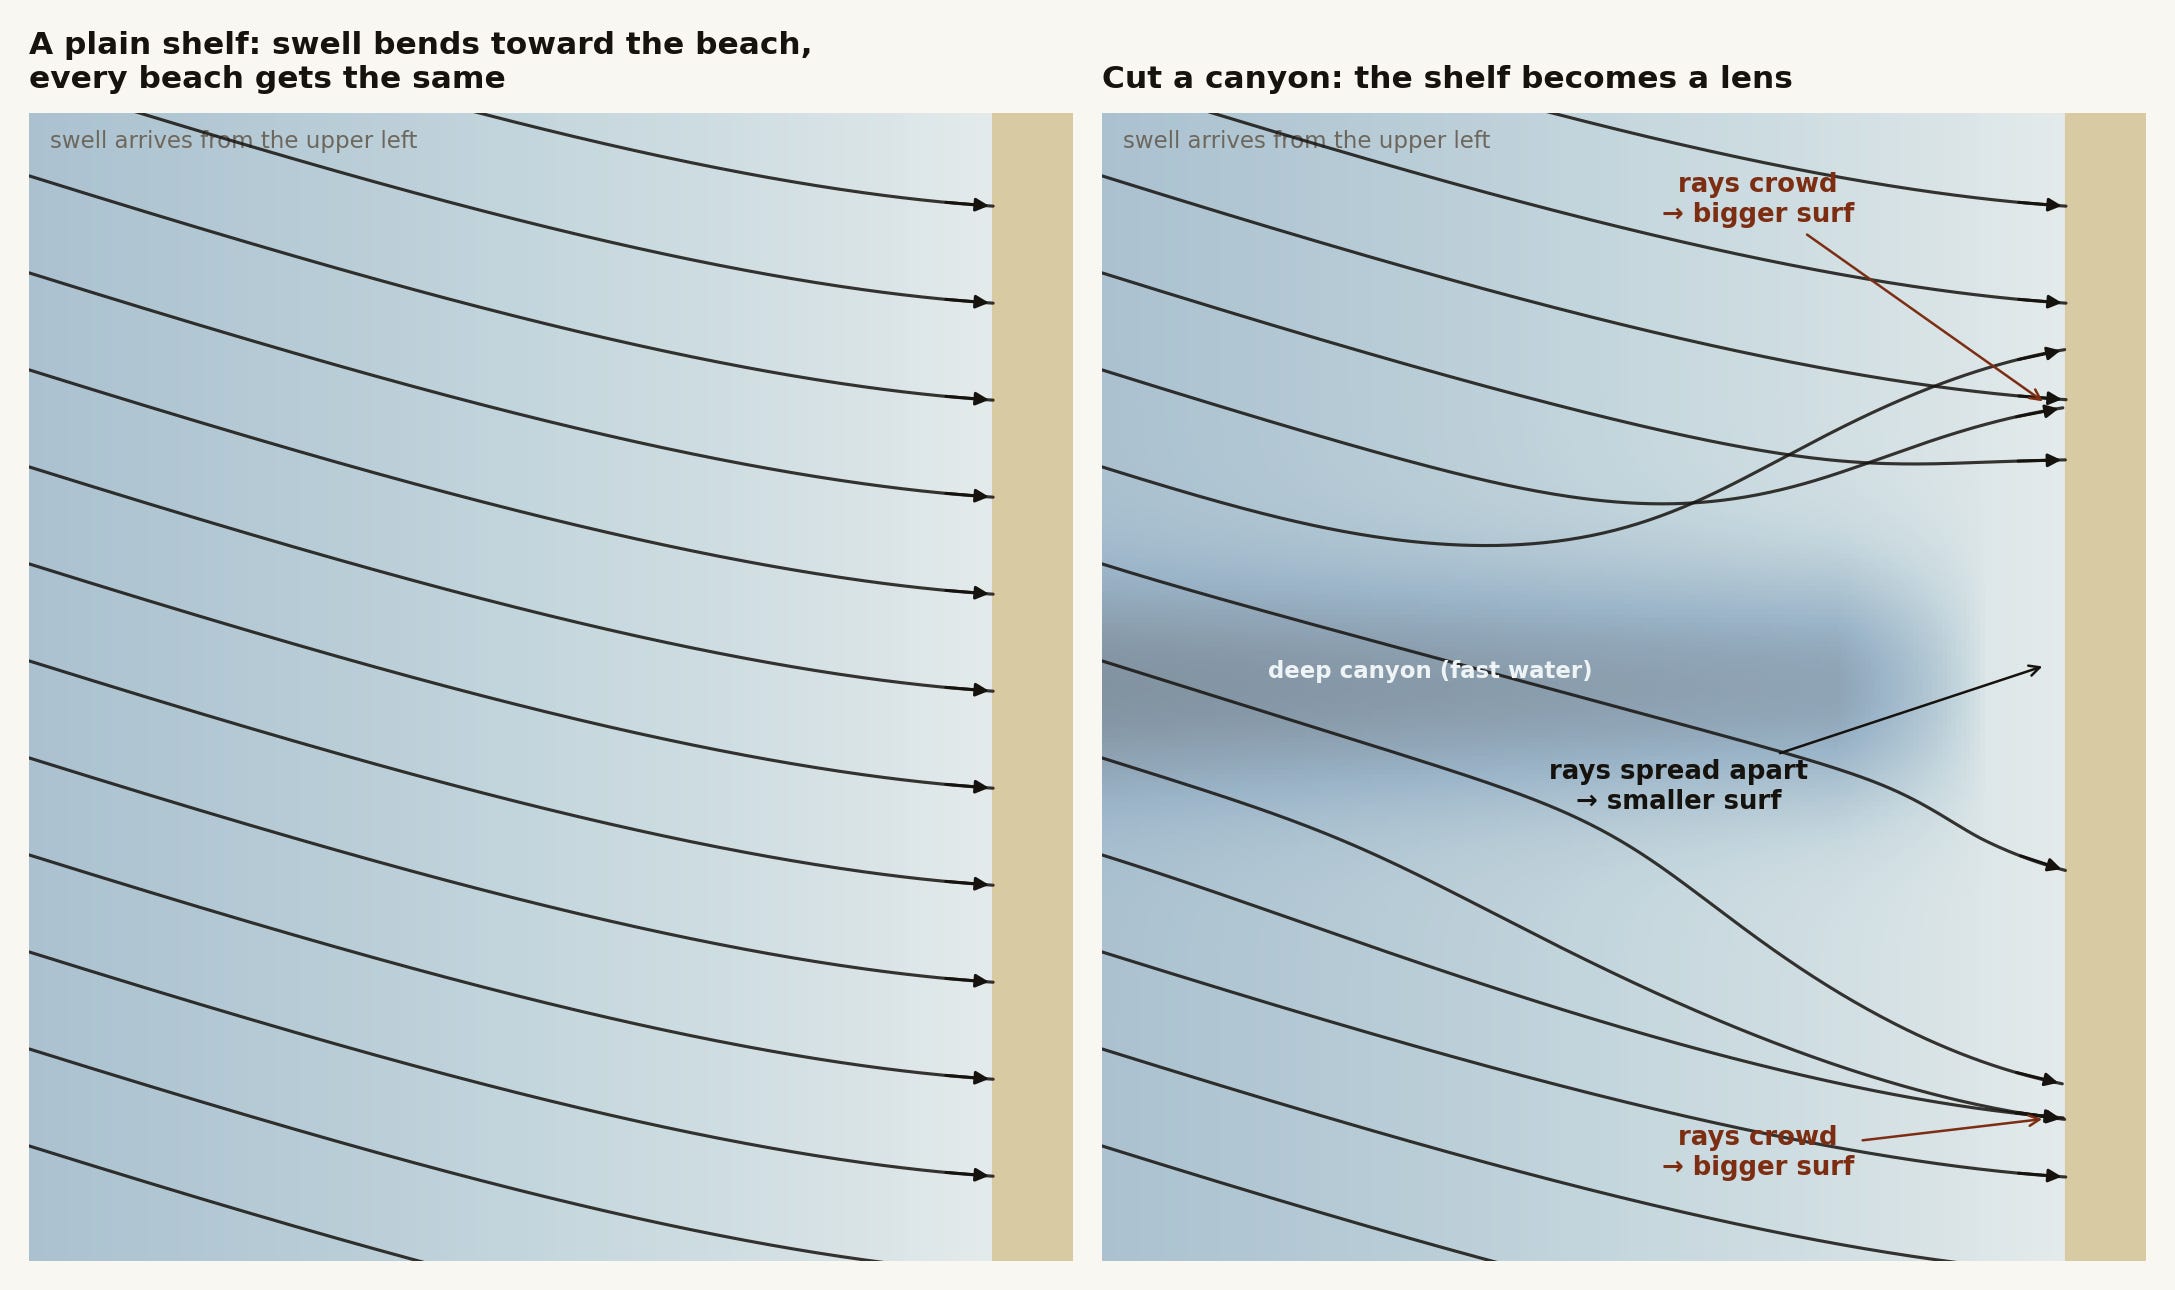
In 1947, Walter Munk and M. A. Traylor published wave refraction diagrams for the La Jolla canyons, tracing swell paths over the measured bathymetry by hand to predict where the energy lands, methods that grew out of the wartime surf-forecasting problem. The grey rays in the explorer are the same construction, computed live in your browser over the same seafloor, almost eighty years later.
The experiment
Ray diagrams predict where the energy should go. The model actually moves it, wave by wave, and the two oceans (real and canyon-removed) let us see how the canyon changes things: divide the wave height over the real seafloor by the wave height with the canyon erased. Red is where the canyon makes that swell bigger, blue is where it makes it smaller. Working in ratios also cancels the model’s main weakness, a slow numerical bleed of wave energy with distance, because both oceans bleed identically.
On southerly groundswell the focus lands on South Peak at Black’s: about 80 percent bigger at 16 to 20 seconds, the canyon close to doubling that swell at the peak. A second hot band sits on the canyon’s north rim, halfway between the Shores and the pier, and it holds the largest number in the whole matrix, peaking above plus 100 percent on an 18 second swell from due south. The energy for both of these comes out of La Jolla Shores. In those same souths, it gives up 40 to 65 percent, growing worse as the period stretches.
From due south the hot bands sit at the rim by the pier and at South Peak. By west-southwest the brightest band is South Peak proper. From the west and west-northwest the focus strays from Black’s and lands on Torrey Pines. Stretching the period at a fixed direction causes the band to migrate the same way, north.
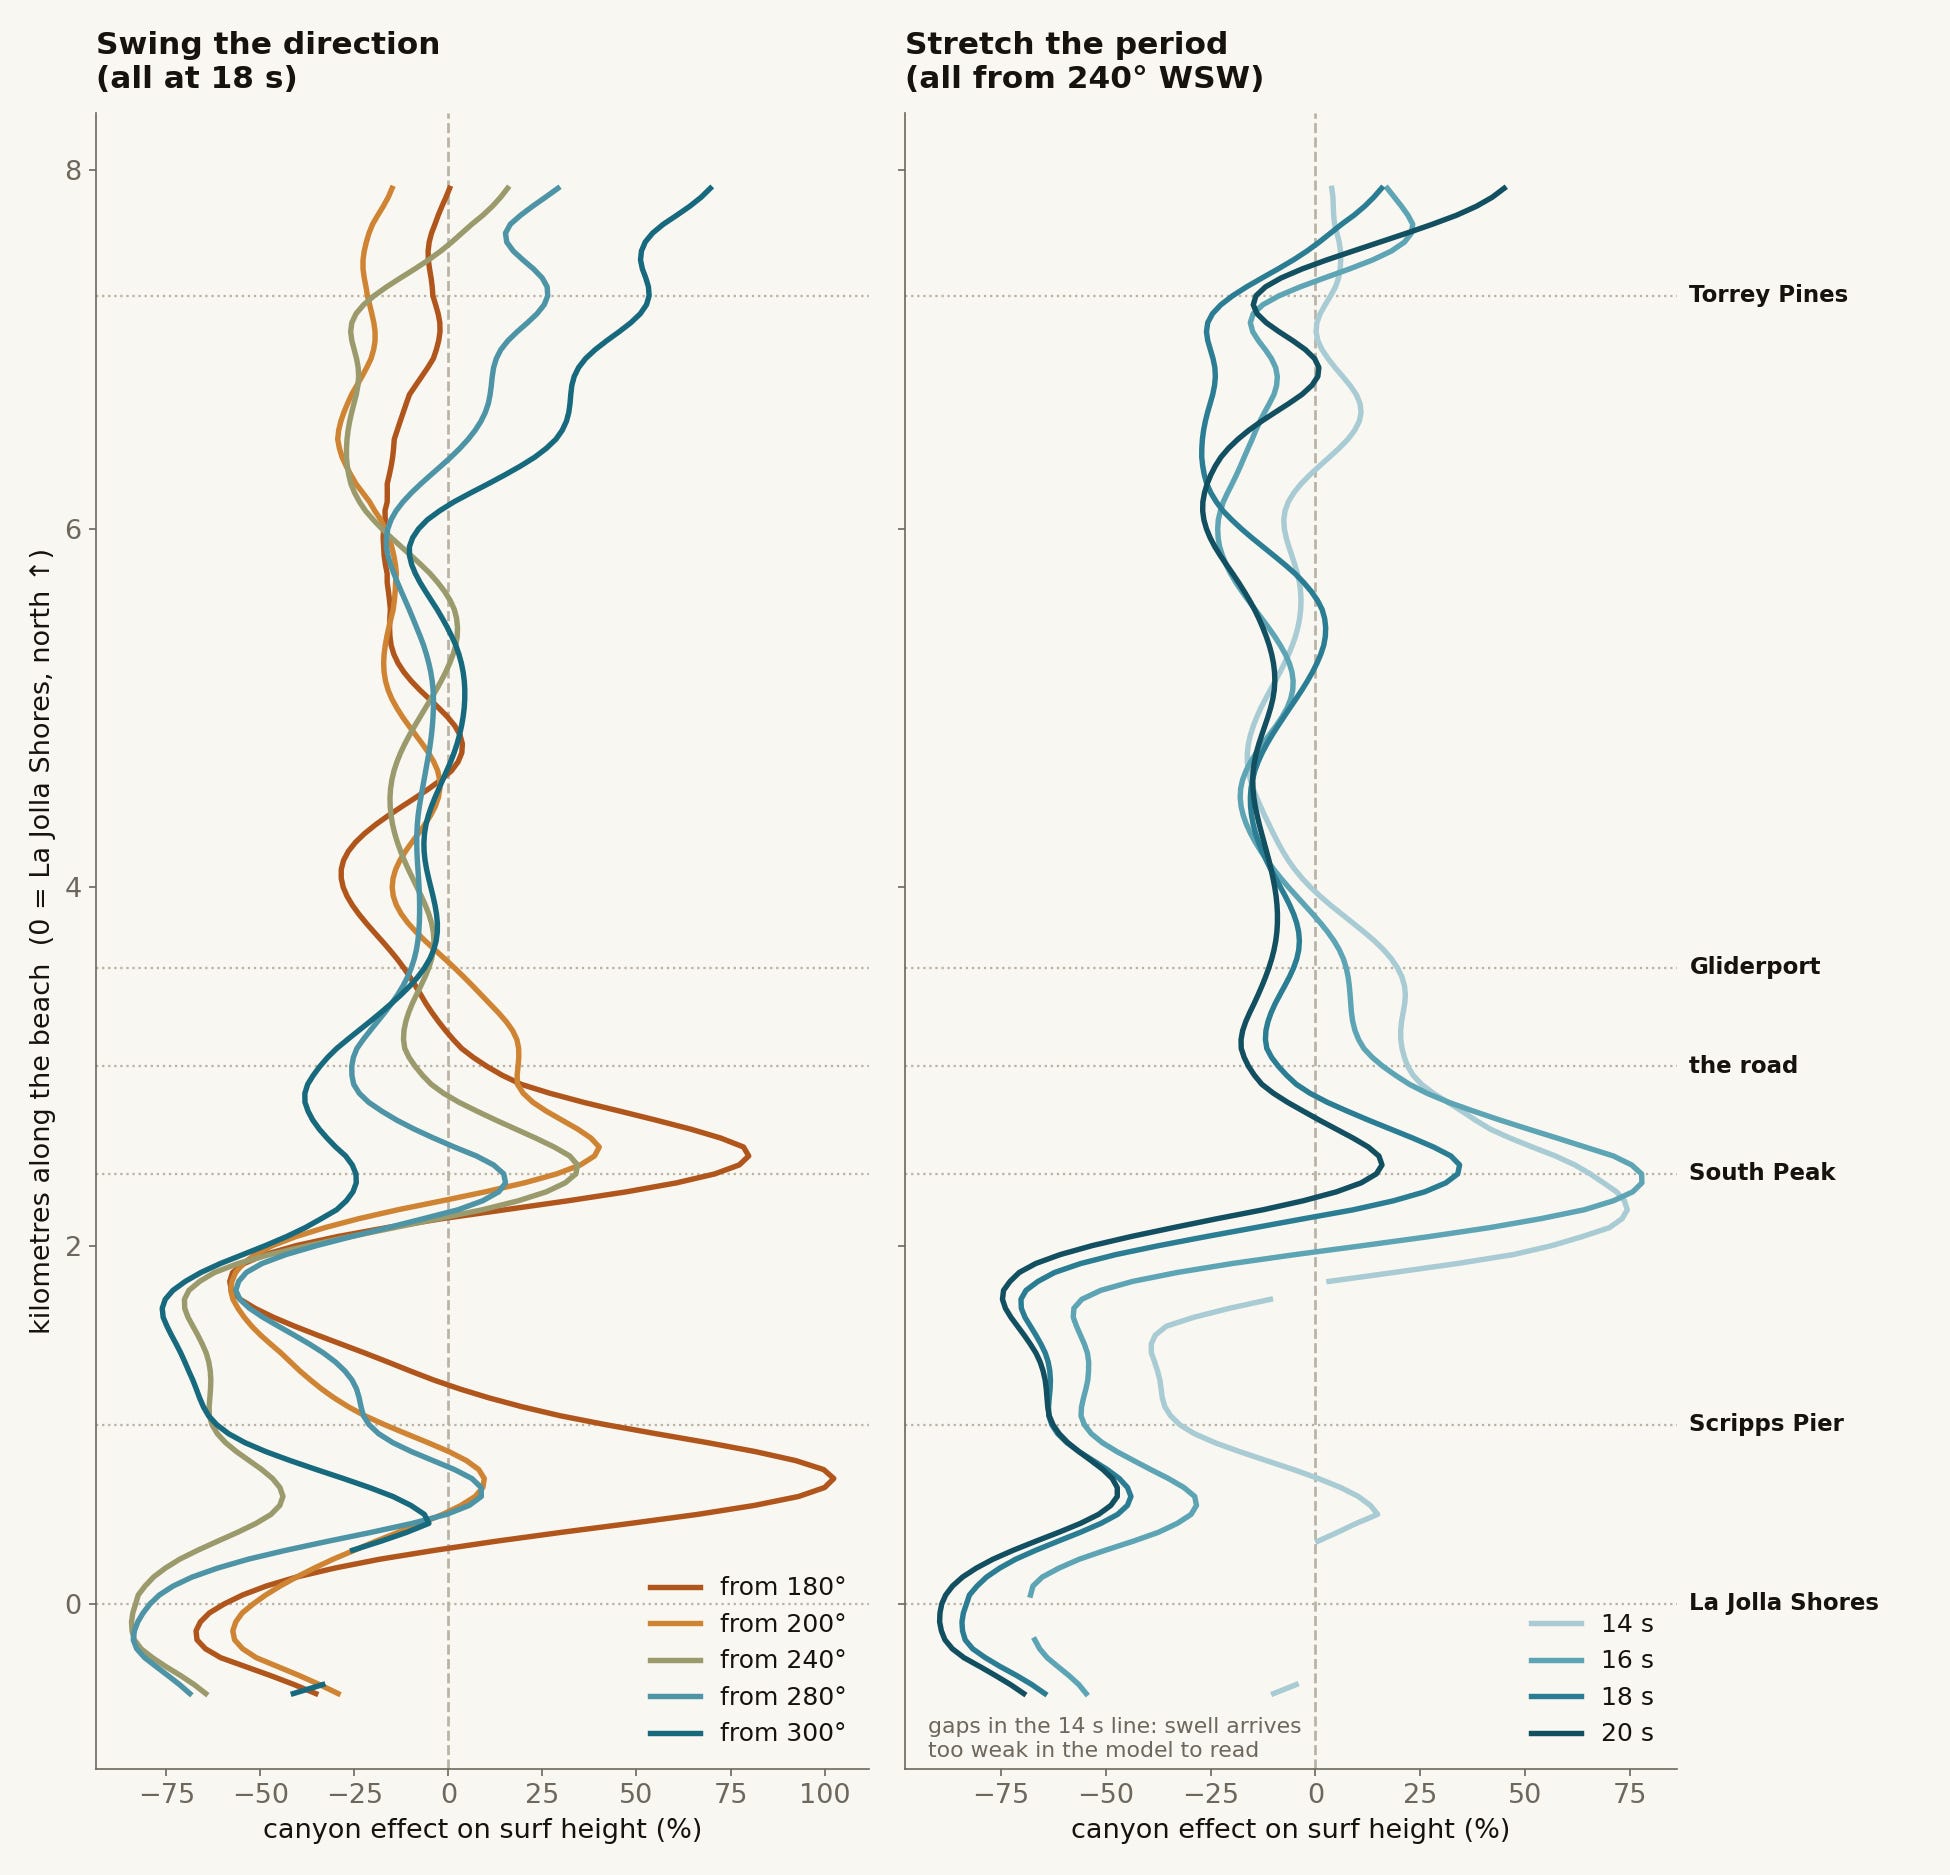
The shadows scale simply: the longer the period, the deeper the shadow, the Shores sliding from minus 40 percent on a 14 second south to minus 65 on a 20 second one, exactly what the depth-reach argument predicts. The focus is messier. Amplification at a fixed spot can drop as the period stretches, not because the canyon’s effect weakened but because the focal band moved. From the west, South Peak reads plus 72 percent at 14 seconds and minus 6 at 20, while Torrey Pines, the next stop north, holds between plus 30 and plus 54 across the same stretch. Longer period does not simply mean a stronger canyon effect at your break. It can also mean the focal band is now somewhere else.
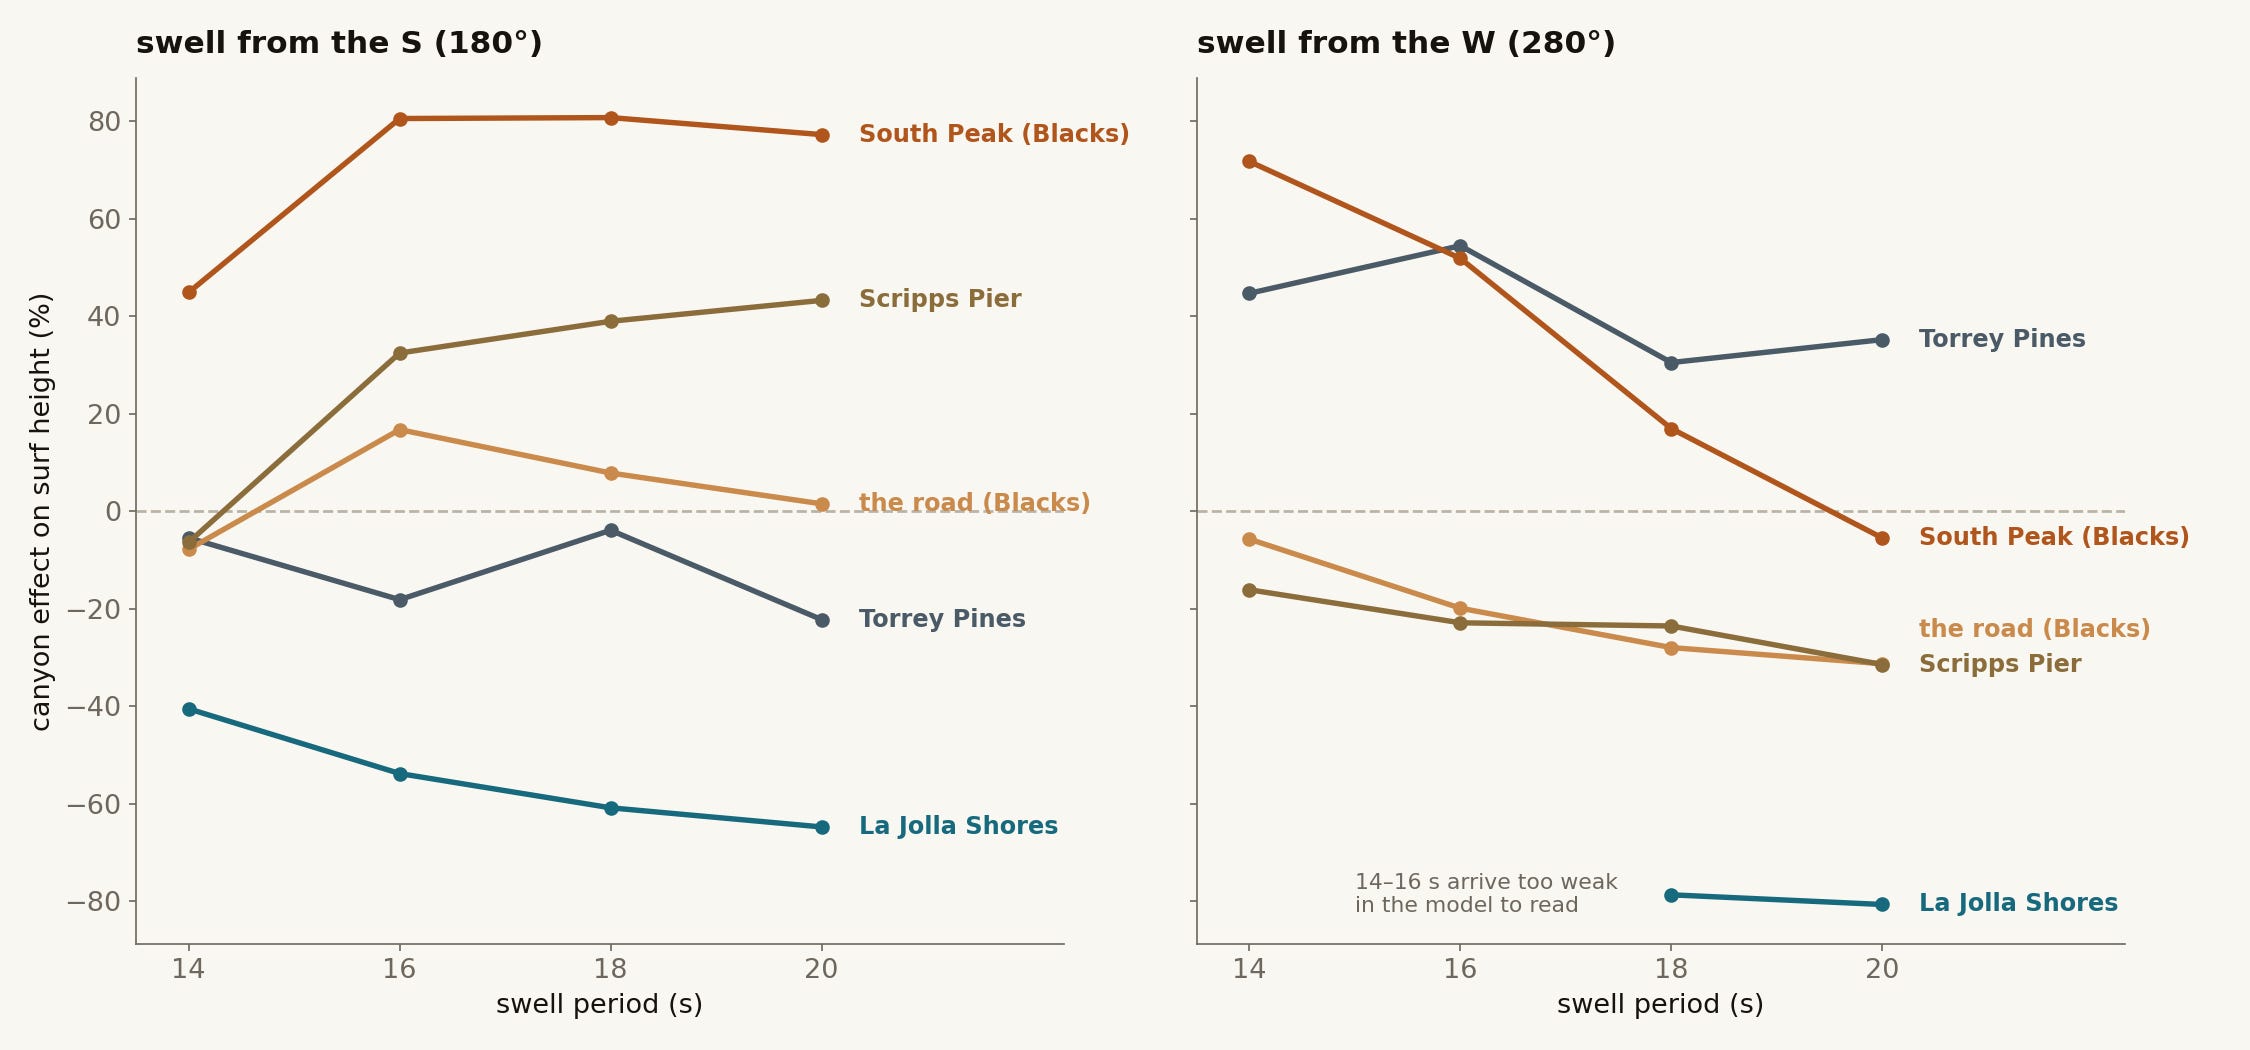
In the real-seafloor runs, the Black’s stretch comes out bigger than the pier and the Shores in nineteen out of nineteen readable swells. But on many of those swells, the canyon is barely boosting Black’s at all. Rather, it is gutting the neighbors, taking 64 percent off the pier and 89 off the Shores during a long west-southwest.
The reputation for Black’s Beach is half amplification and half everyone else’s shadow, and luckily, the shadow half has been measured directly. When Magne and colleagues ringed this canyon with wave buoys for a 2007 study, they measured wave height dropping by a factor of five from one side to the other, over a distance shorter than a single wavelength.
Second order: which part of the canyon does the work
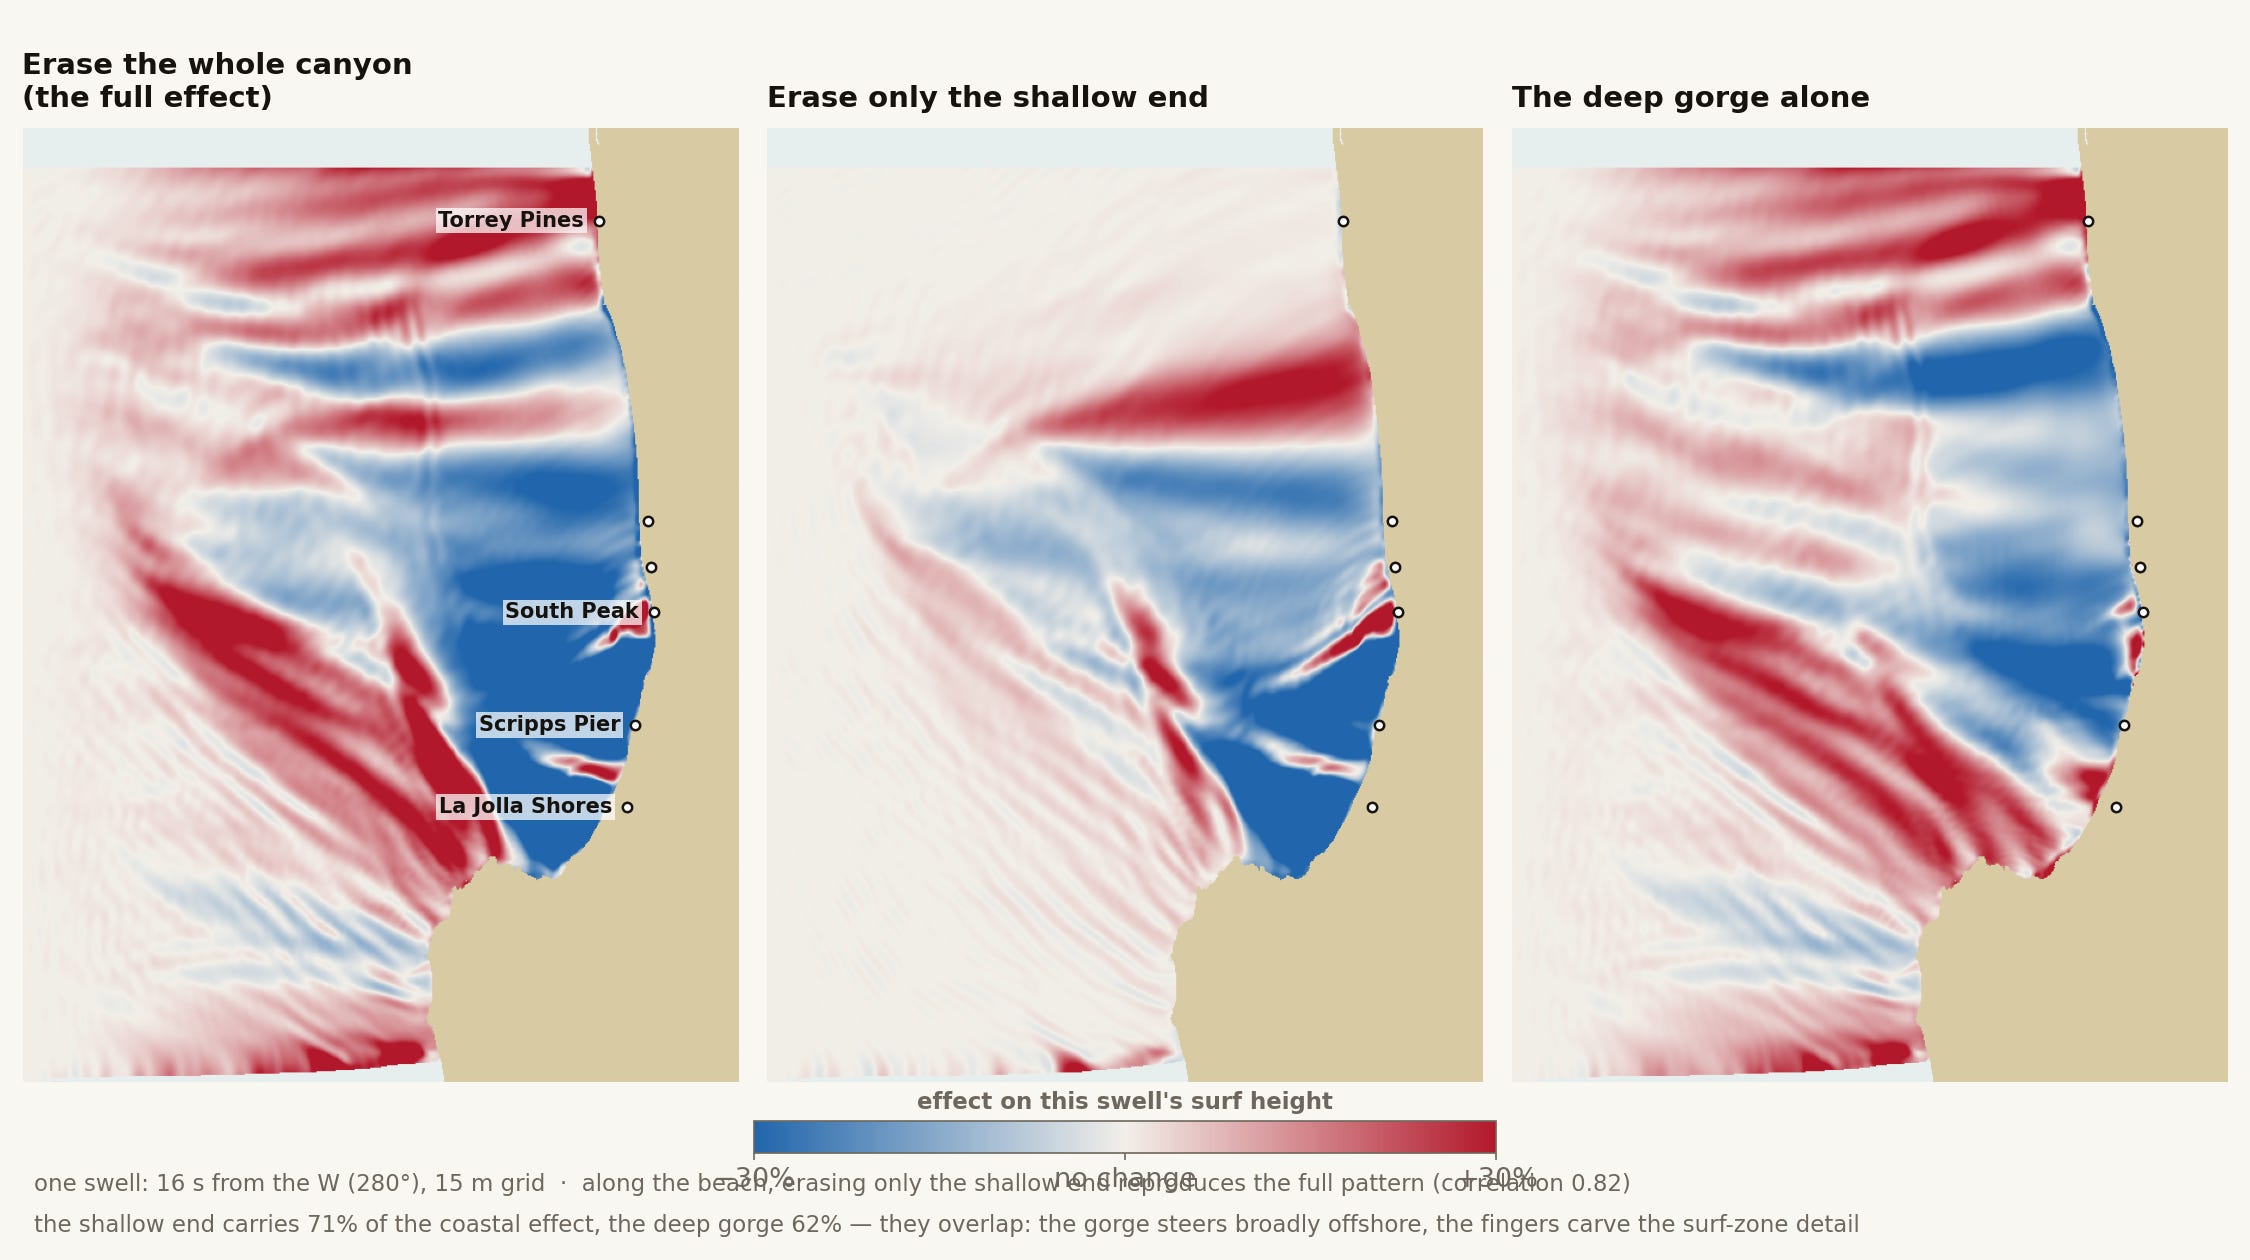
The canyon is really two things: a gorge hundreds of meters deep running offshore, and a set of narrow fingers cutting the last kilometer of shallow shelf. Because we can erase it in two layers, we can ask which portion does the most to the swell. Filling only the shallow fingers and re-running a 16 second west swell, the pattern along the beach comes back nearly unchanged. Leaving only the deep gorge still moves plenty of energy, about 60 percent as much, but in broad strokes, offshore. The detail that determines which peak breaks where comes from the fingers. This is one swell, so hold it loosely, but the part of the canyon that matters most to your session appears to be the last shallow kilometer, not the deep gorge behind it.
And now, a word on what this can’t do. The maps show the shape of the canyon’s effect, not a wave-size forecast, and the model’s absolute heights are not trustworthy by design, which is why every number here is a ratio between the two oceans. Between the five modeled directions the explorer blends neighboring runs, a smooth guide rather than model output. Swells at 12 seconds broke the model, the grid is too coarse to resolve them, and parts of the 14 second runs arrive too weak to read, which the tool shows as grey. The last few hundred meters into the sand, sandbars and shorebreak included, are beyond what we resolved.
What does hold up, though, is the geometry. Like the swell window from the first piece, the canyon’s map is a property of the place. For a given period and direction the pattern repeats exactly (minus effects such as tidal elevation, background currents, wave-wave interaction, etc.), and all twenty patterns are in the explorer →
This is the third post of our First Order series. Tools accompany each piece, so they arrive when the tool is done rather than on a schedule. All tools are free and open-source, built for the curious surfer. Check this one against your favorite forecast next groundswell and let me know how it does.
Further Reading: