

Two breaks a few miles apart can read the same buoy and yet be nothing alike. One is overhead and lined up, the other is a letdown. I have driven past a firing break to go check a dead one on the same swell enough times to wonder why.
Every break receives swell through a certain window, and no two breaks have exactly the same window. That is the whole answer, and the rest of this piece is about learning to see it.
To get there, we will borrow the standard physicist’s trick for problems too messy to solve outright: solve a cartoon of the problem first, then correct the cartoon in layers. The first pass is deliberately too simple. Each pass after that adds back one piece of ignored reality, and you stop when the answer is good enough for the decision in front of you. The jargon for this is orders of approximation: zeroth order for the cartoon, first order for the first serious correction, second order for the fine print, and higher orders beyond that. When a physicist calls a number “right to first order,” they mean it is the napkin answer: not exact, but close enough to act on, and honest about what it ignored.
That is where this series gets its name. First Order is a set of interactive tools, each built around one question surfers argue about, each answered in layers you can see and drag. The articles walk up the ladder; the tools let you play with it. This first one takes on the question in the title, because swell direction is the corner of forecasting where the napkin answer does the most work. To make it visible I built an interactive map of the Southern California Bight, the long bend of coast between Point Conception and San Diego, over its real seafloor, for ten of its well-known breaks. Every number below comes from it, and you can check each one yourself: open the explorer →
Zeroth order: swell goes straight
A storm is a wave generator parked over deep water. For a day or two it drags on the sea surface, piling chop into bigger and bigger waves, and when those waves finally outrun the wind that made them they become swell: organized, long-crested, and pointed wherever they were heading when they escaped. That direction is fixed at the moment of escape, like a bullet out of a barrel. Deep water barely touches a swell afterward. A 14 second swell covers about 940 kilometers of open ocean a day, and left to its own devices, does not turn. Whatever heading it left the storm with is the heading it arrives with, days and thousands of kilometers later.
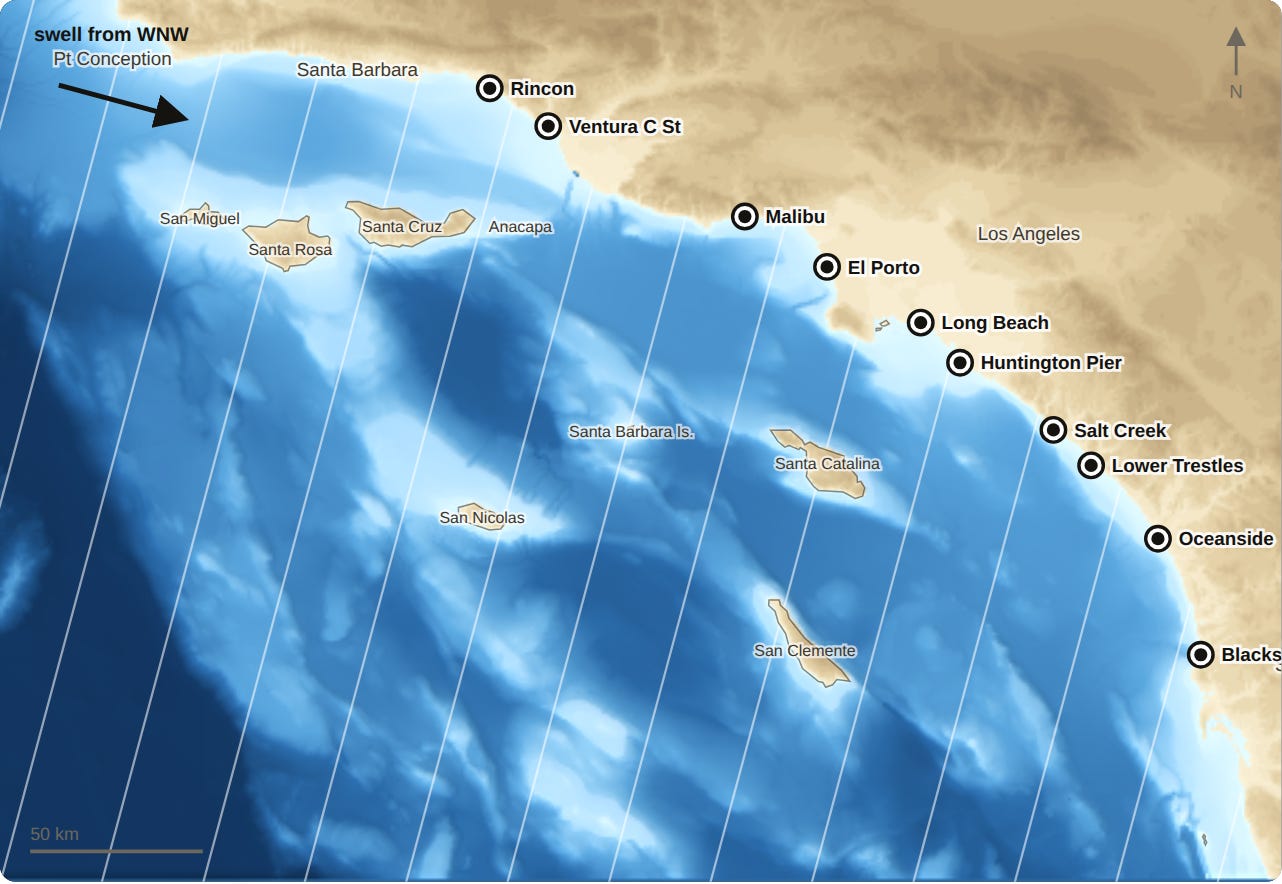
So the simplest model of surf, the zeroth order cartoon, is a ruled sheet: parallel crest lines sweeping across the map from wherever the storm sat. Most of a forecast lives inside this model. When the chart says 285 degrees at 15 seconds, it is describing the simplest picture. The first number is where the lines come from. The second is their period, the time between one crest and the next.
First order: draw the sight lines
From the lineup, let’s imagine drawing a line straight out to the open ocean and swinging it across the horizon. The arc where that line reaches deep water without running into anything is your swell window.
Everything you ever surf (I know, I know: rivers, cruise ship waves, weird quirks aside) comes through it. Whatever sits inside that arc, an island, a headland, the bend of the coast itself, blocks the swell that would have arrived from behind it. The window is a property of the place, not the weather. It doesn’t change with what the buoy is reporting, and on any timescale that matters to a surfer, it never changes. A swell either comes from inside your arc or, to first order, it does not exist for you.
To a wave, an island is a wall. Swell cannot pass through rock, so a body of land drops a shadow on the water behind it, stretching downswell the way a building blocks the sun, and the Channel Islands are walls that run tens of kilometers end to end. A break parked in one of their shadows misses out on swells from a huge patch of ocean offshore. Not weakened, gone, at least in the straight-line version of the story.
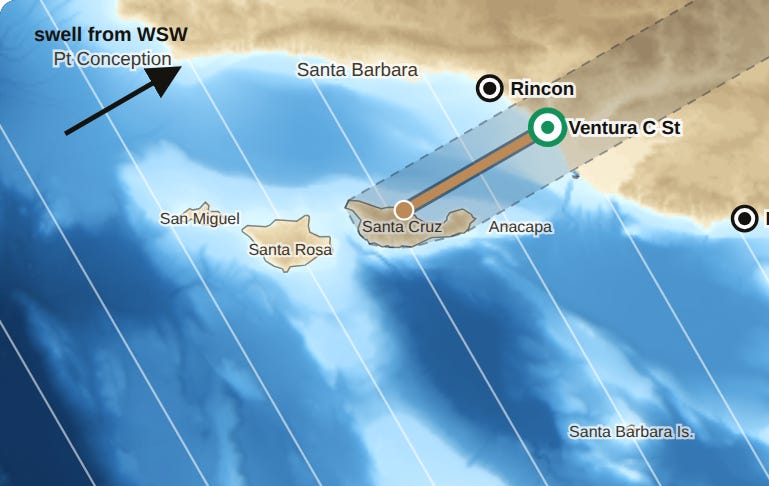
The explorer draws this for ten breaks, using the islands’ real outlines traced from the bathymetry, with every sight line starting at the sand, and the spread is hard to ignore. Oceanside and Lower Trestles tie for the widest window of the ten, 88 degrees each. Long Beach sees 42, and most of what it lost sits in plain sight: Palos Verdes, the breakwater, and Catalina stacked across its horizon. If you have ever wondered why Long Beach is the flattest town on this coast, its window is the answer.
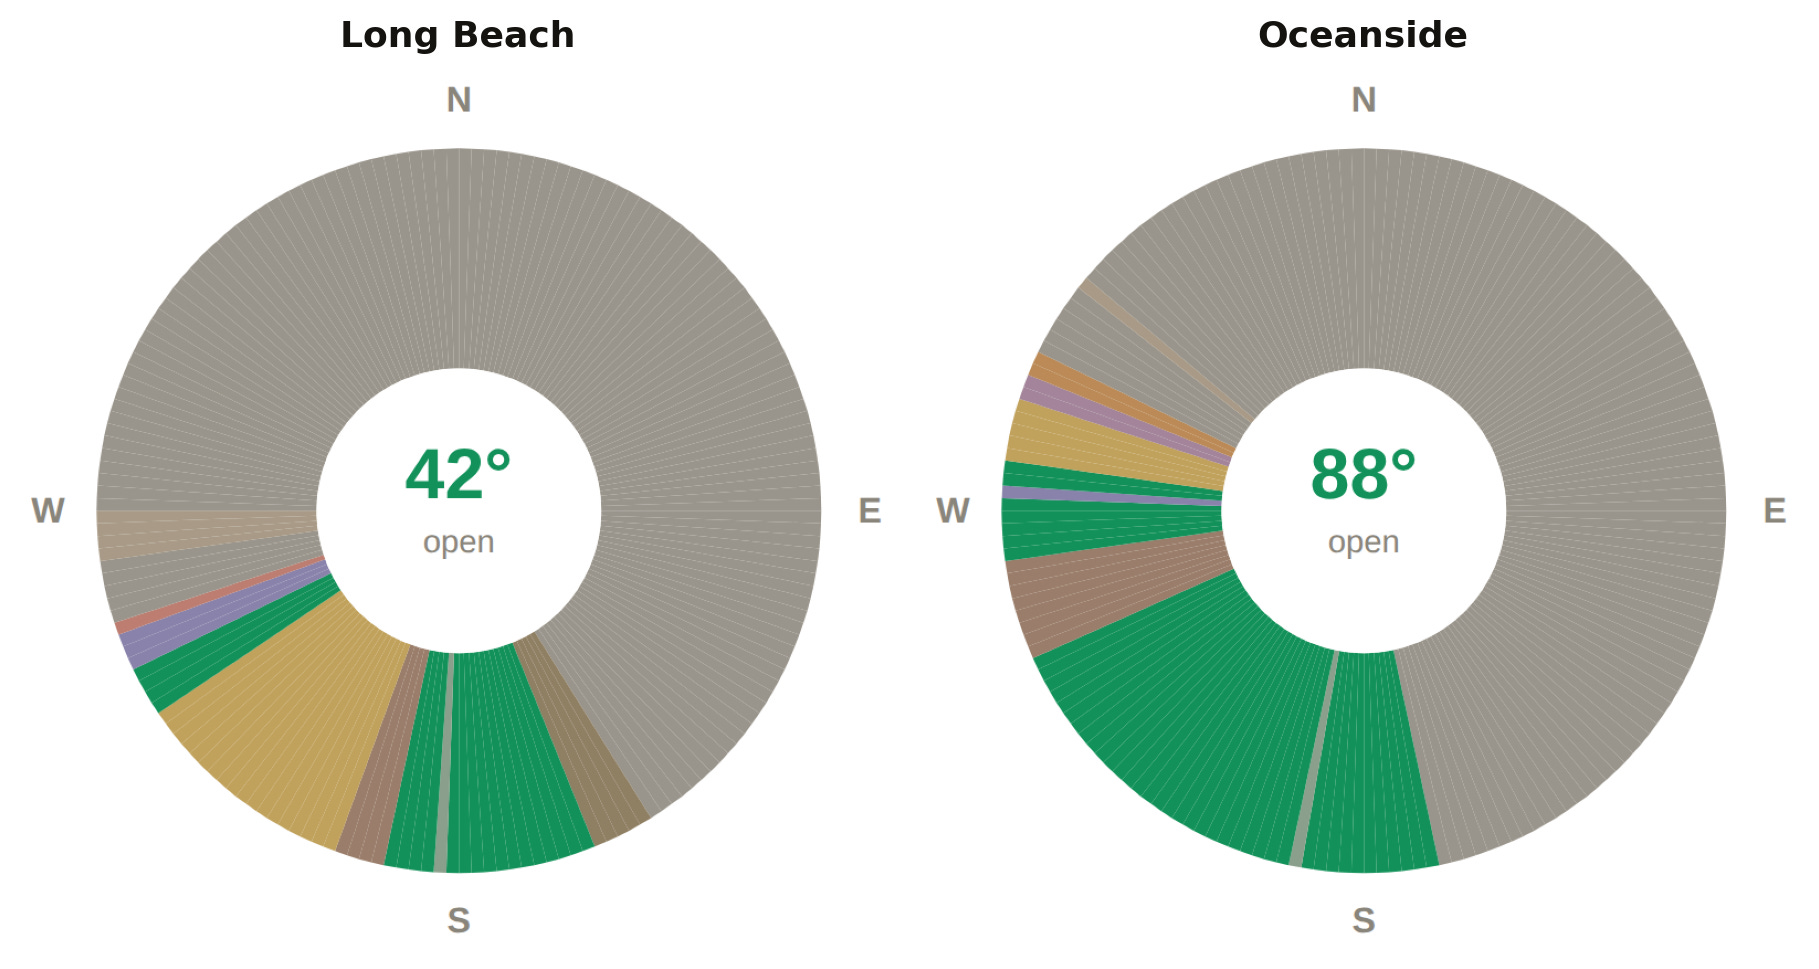
The blocking wall that matters is often the one down the beach. Point Dume covers a wedge of Malibu’s west. Dana Point takes Salt Creek’s south. La Jolla eats swell south of Blacks. None of these headlands is large by island standards, but blocking is about the angle a wall covers, not its size, and a point a few kilometers away covers more horizon than an island forty kilometers out, the same way your thumb at arm’s length covers the moon.
Baja California runs about 1,200 kilometers past the southeast corner of the frame in our tool, but it still closes up to 11 degrees of window here, Malibu most of all. Putting every wall together, no single direction reaches all ten breaks at once. At most, a particular swell hits seven out of ten. At 177 degrees, the best the south can do, the three missing breaks are El Porto, Salt Creek, and Blacks, every one of them shut out by its neighboring headland rather than an island. The wave model W. C. O’Reilly and R. T. Guza built for this bight, the one CDIP still runs, treats the islands as near-solid blocks, because for the directions that matter here that is what they are.
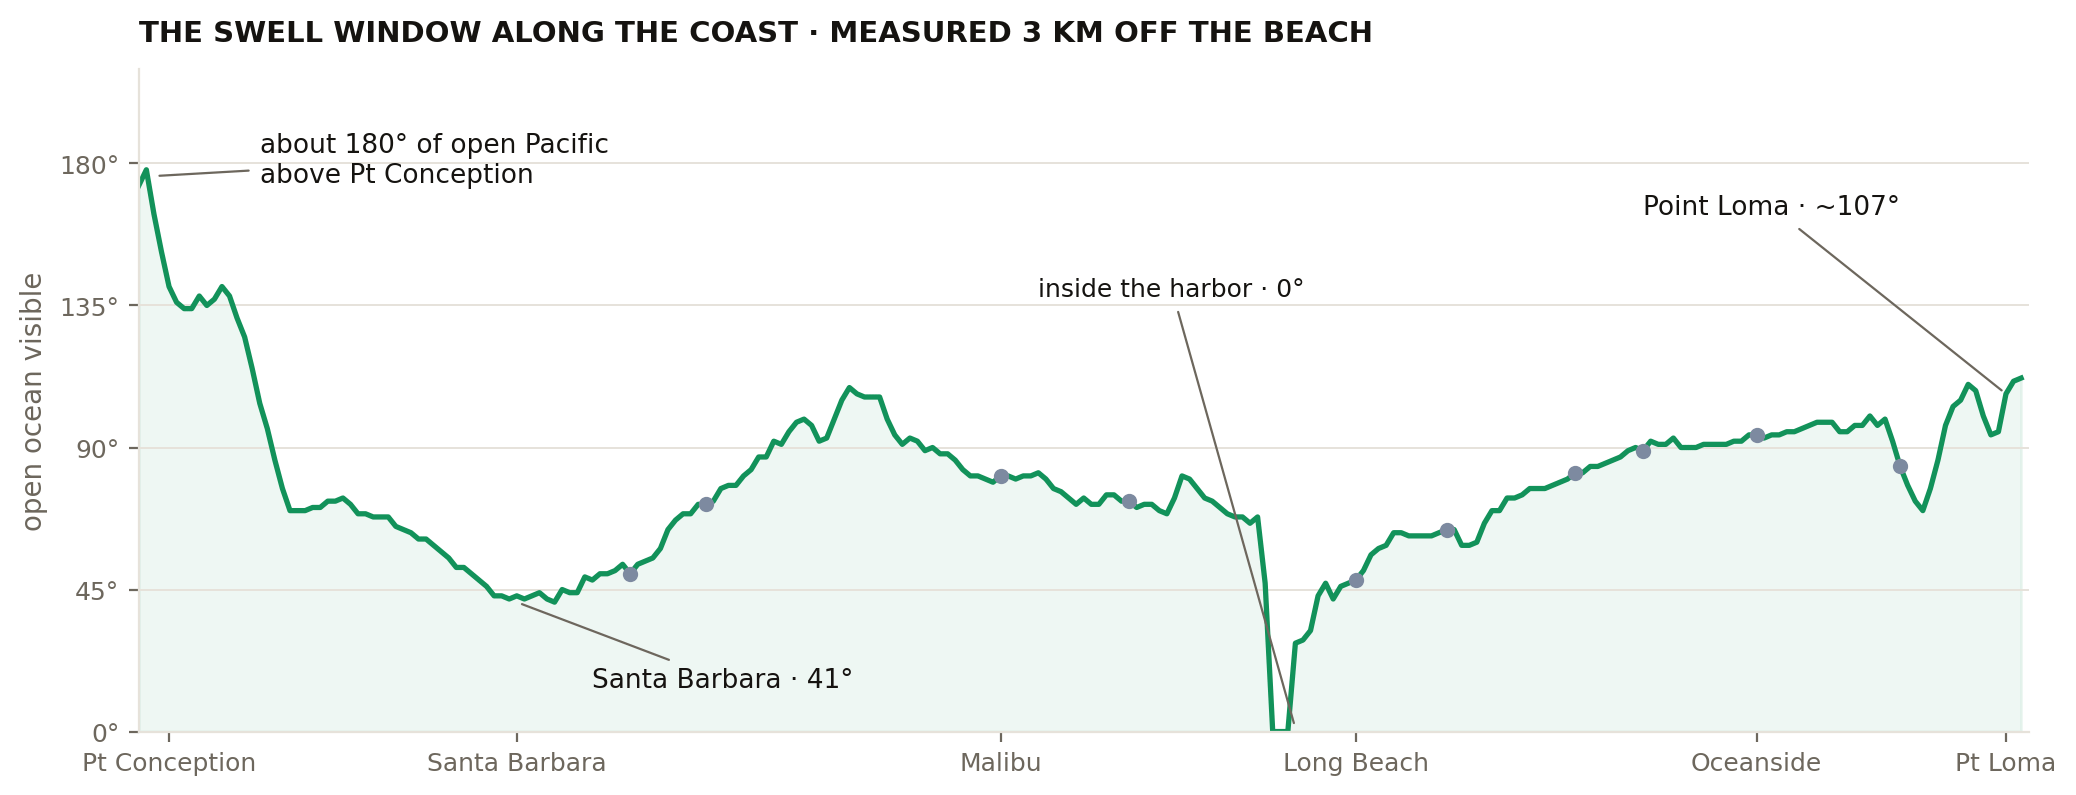
The ten breaks are just samples. Computing the window every two kilometers of shoreline helps us tell the story for the whole coast at once. Reading the figure below left to right is like you are walking the coast from northwest to southeast. Above Point Conception the coast stares at about 180 degrees of open Pacific, the half of the compass not blocked by the state of California. Around the corner into the bight, the window collapses, bottoming out at 41 degrees along the Santa Barbara waterfront, the most sheltered stretch of open coast in Southern California, pinched between Conception wrapping off one shoulder and the four northern islands fencing the other. The water inside the Long Beach breakwater rounds all the way to zero, though that one is by design for ships. From there the window rebuilds slowly, reaching about 107 degrees at Point Loma. Santa Barbara’s summer flat spells are pretty easy to conceptualize with this one figure.
The straight-line model also makes a claim that should bother you. From 300 degrees, the classic winter west-northwest, it reaches zero of the ten breaks. Every one of them hides behind Conception, a headland, or an island from that angle. Yet west-northwest swell is the backbone of a Southern California winter. A model that declares the season’s busiest direction impossible is missing three things. The first is about what actually arrives: a storm is not a point on the map but a weather system hundreds of kilometers wide blowing for days, so the swell it ships is a fan of directions 20 to 40 degrees across, not a single line. The 300 on the chart is the middle of the fan, and the fan’s southern flank reaches down toward whatever slivers the windows leave open. The other two are physics the straight lines ignore: shadows are not hard-edged, and the seafloor steers. Those are the higher-order corrections, and they are the rest of this piece.
The first correction: shadows are soft
Waves do not travel in perfectly straight lines. They bend into the space behind an obstacle, a process called diffraction, and you already know it intuitively from sound: you can hear someone around a corner you cannot see them through. Sound waves are meters long and bend easily around obstacles their own size; light waves are a millionth of that and barely bend at all, which is why you can’t see around those same walls. Ocean swells, with wavelengths in the hundreds of meters, live on the sound side of that divide.
Penney and Price worked out the math for water waves in 1952, borrowing the optics of light slipping past a straight edge, and their results are very useful to us. Right at the edge of the ruler-drawn shadow, a wave stands at about half the height it carried in the open, and it keeps dropping the deeper into the shadow you go. Real seas do a little better than the math, because a real swell arrives as that fan of directions rather than a single line, and parts of the fan slip past the island’s edge at friendlier angles; accounting for the fan and the shadow’s edge pushes it closer to seventy percent of open height. Either way, a shadow is not a clean wedge of dead water. It is darkest straight behind the island and feathers out toward the edges. I did some work on a project looking at the diffraction of internal waves around an island, and I can tell you what was told to me when I got stuck: diffraction is difficult. We’ll leave the math here for this one because it’s gnarly.
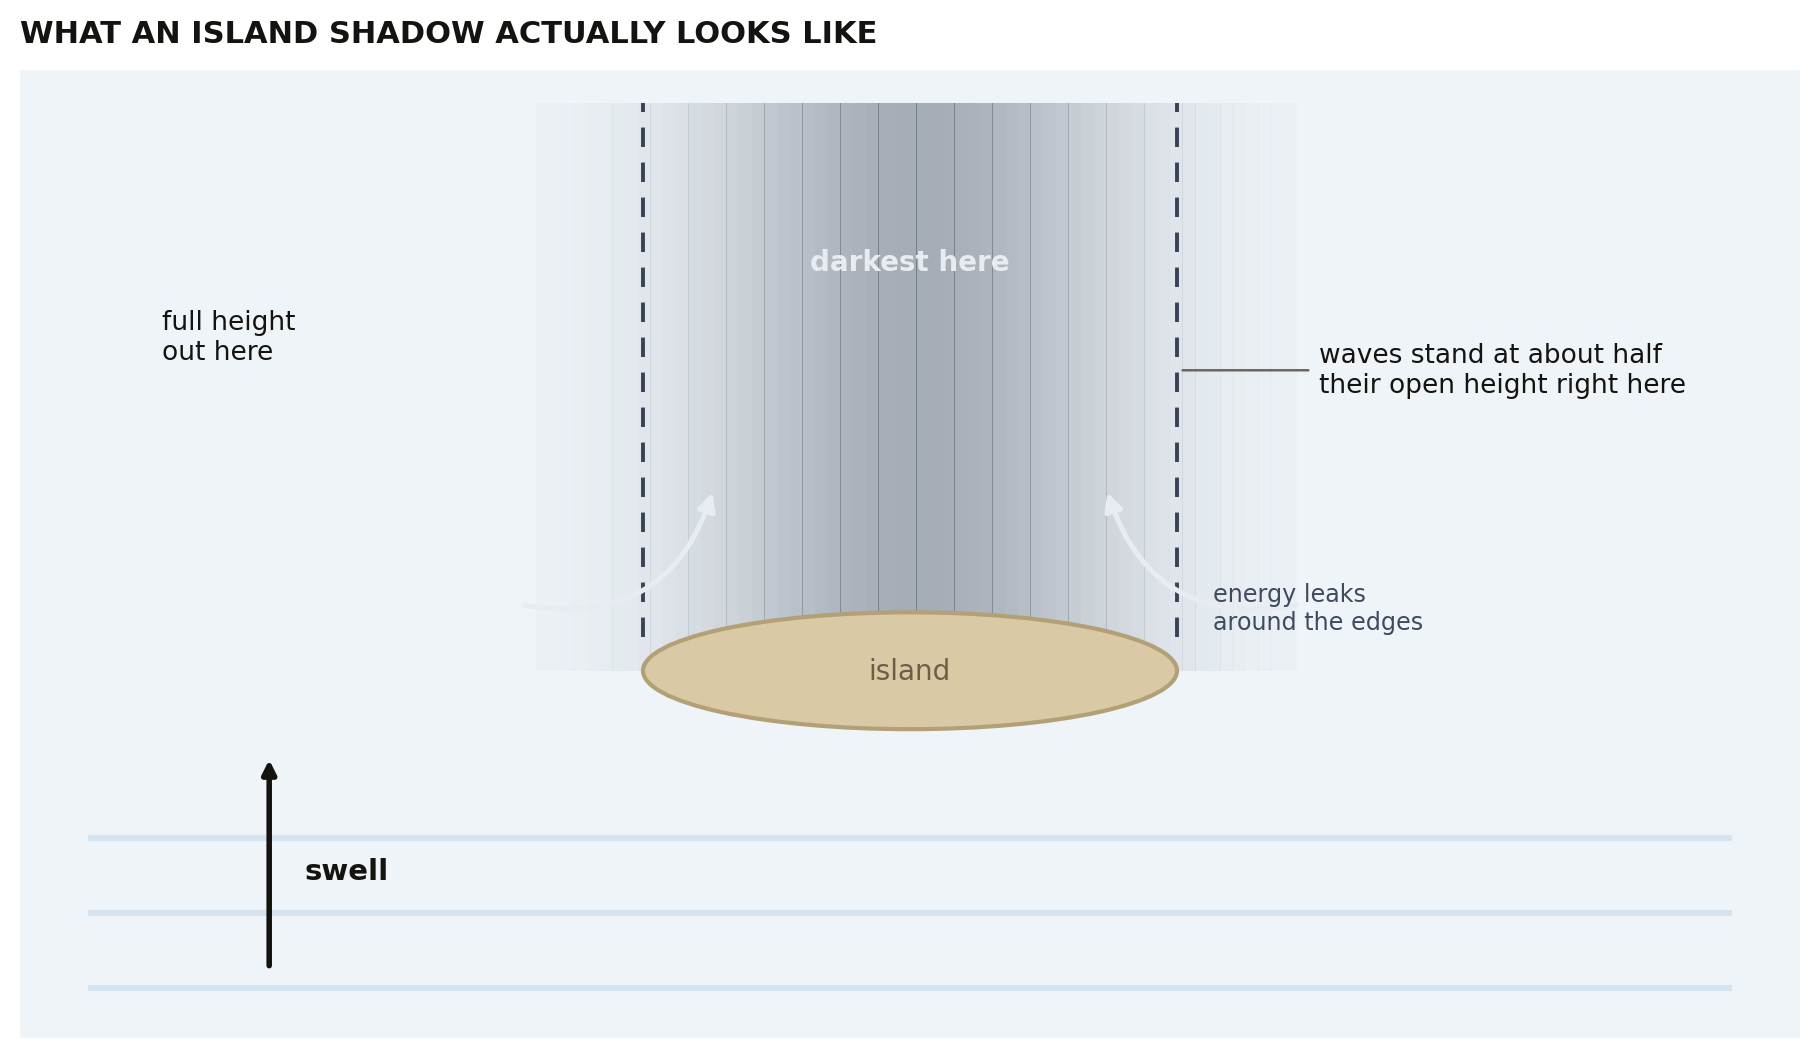
How far the swell bleeds into the shadow depends on its wavelength. Deep-water wavelength grows with the square of the period, from about 156 meters at 10 seconds to 625 at 20, and a wave bends more when its wavelength is large compared to whatever is blocking it. An island tens of kilometers across always throws a real shadow, but a 20 second groundswell wraps into a lee that a 10 second windswell runs past. Long-period south fills corners that short-period south never reaches.
The second correction: the seafloor steers
A wave in deep water does not know the bottom exists, because a wave is not just the moving hump you see. Under every crest the water is circling, and the circles shrink with depth until, about half a wavelength down, the motion dies out. If the seafloor sits below that depth, the swell passes over it untouched. If the seafloor pokes up into the circles, the wave feels the drag and slows. This is the basis of refraction.
A 6 second swell, wavelength 56 meters, wakes up to the bottom in about 28 meters of water, 90-odd feet. In the grand scheme of the ocean, this is practically at the beach. An 18 second swell feels bottom in 250 meters, which in this bight means it is already steering as it threads between the islands. And where one end of a crest slows before the other, the whole crest pivots toward the shallow side, the way a shopping cart with a janky wheel pulls towards the jammed side. Long swells begin turning tens of kilometers out. Short swells run straight until the final moments.
To show this in the explorer, I’ve actually coded this process backwards. Wave paths are reversible, the route from deep ocean to the sand is the same route walked in either direction, so the explorer traces rays outward from each break across the real seafloor and keeps every path that reaches open water. This allows you to pick a break and see the whole family at once, every route a swell of that period can take to get in.
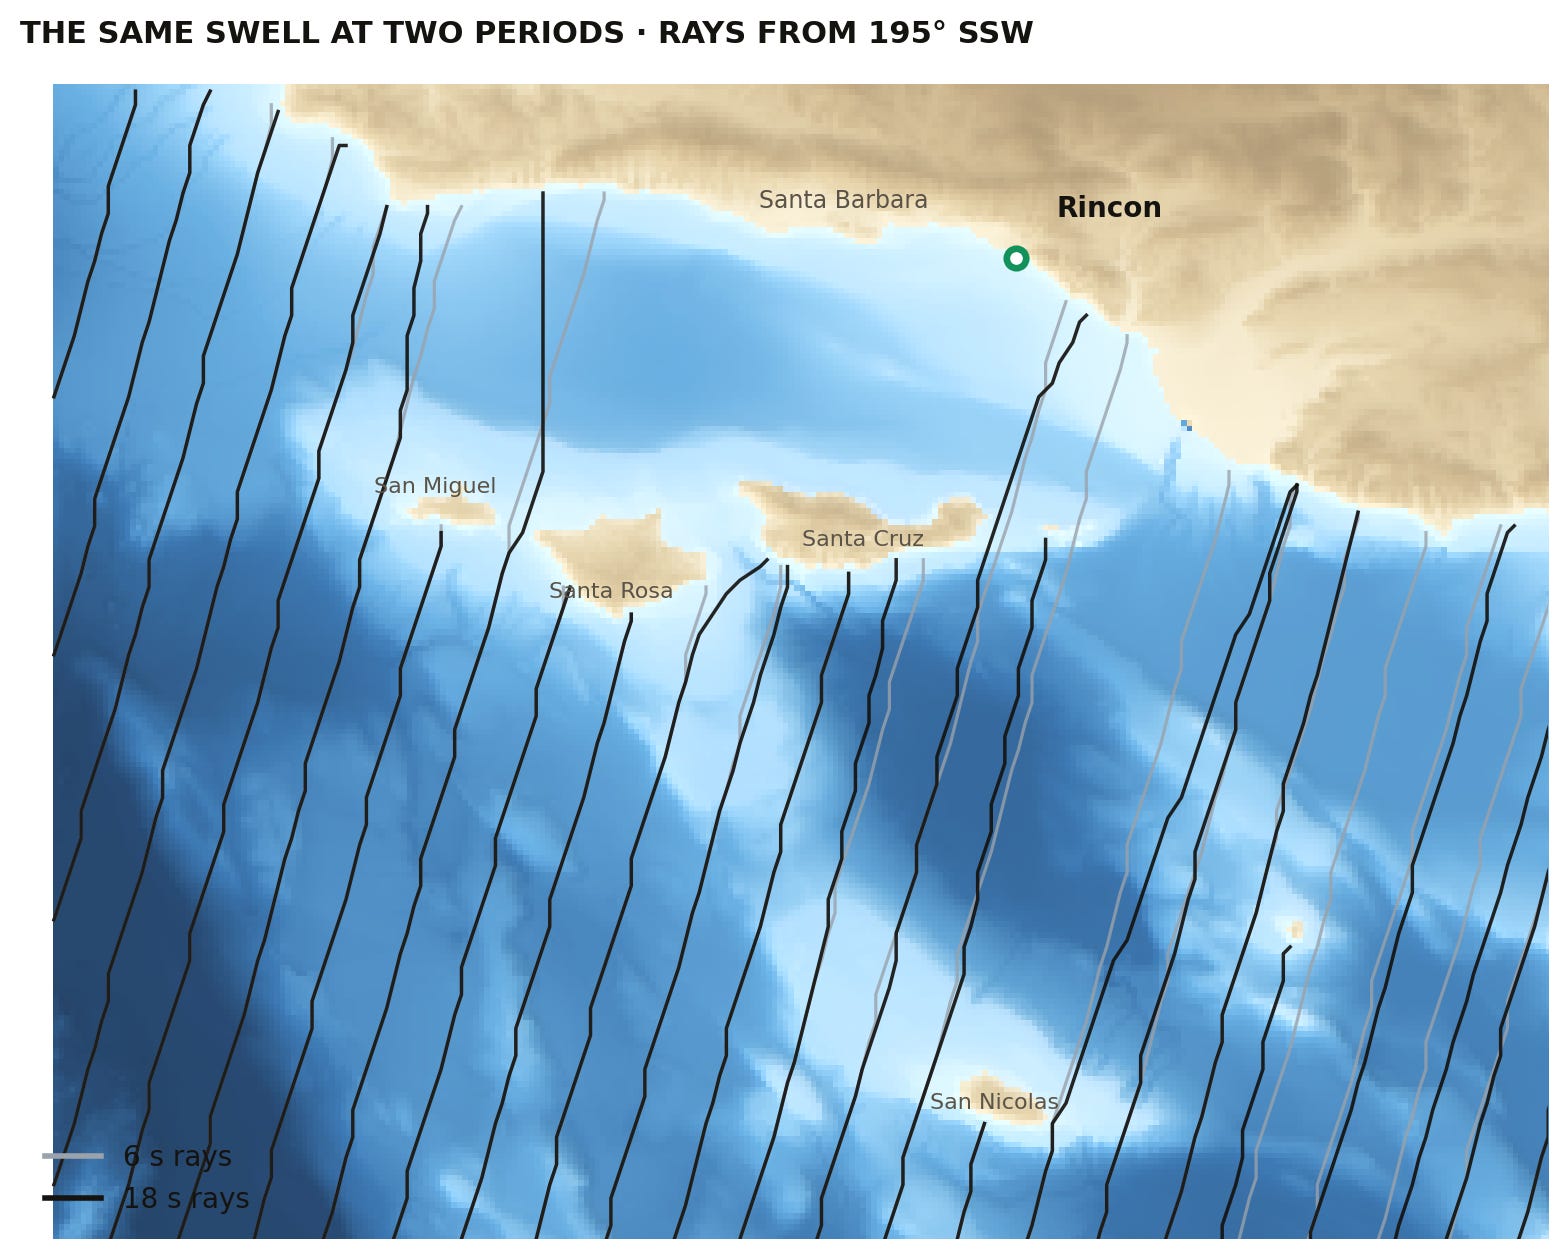
Try it: drag the direction and the swell’s route goes bold. Adjust the period and the fan reshapes a bit: some routes detach at long period, bending off grazing approaches before they arrive, and new ones appear where the seafloor wraps swell around a corner. At 18 seconds, Long Beach picks up west swell bent around Palos Verdes from directions no 6 second swell can deliver.
Below, I show the same physics run forward, one swell at two periods: every ray pair starts together offshore, and by the time they cross the island shelves the 18 second rays have peeled away from their 6 second twins, hooking into the Santa Barbara Channel while the short-period rays run straight past it.
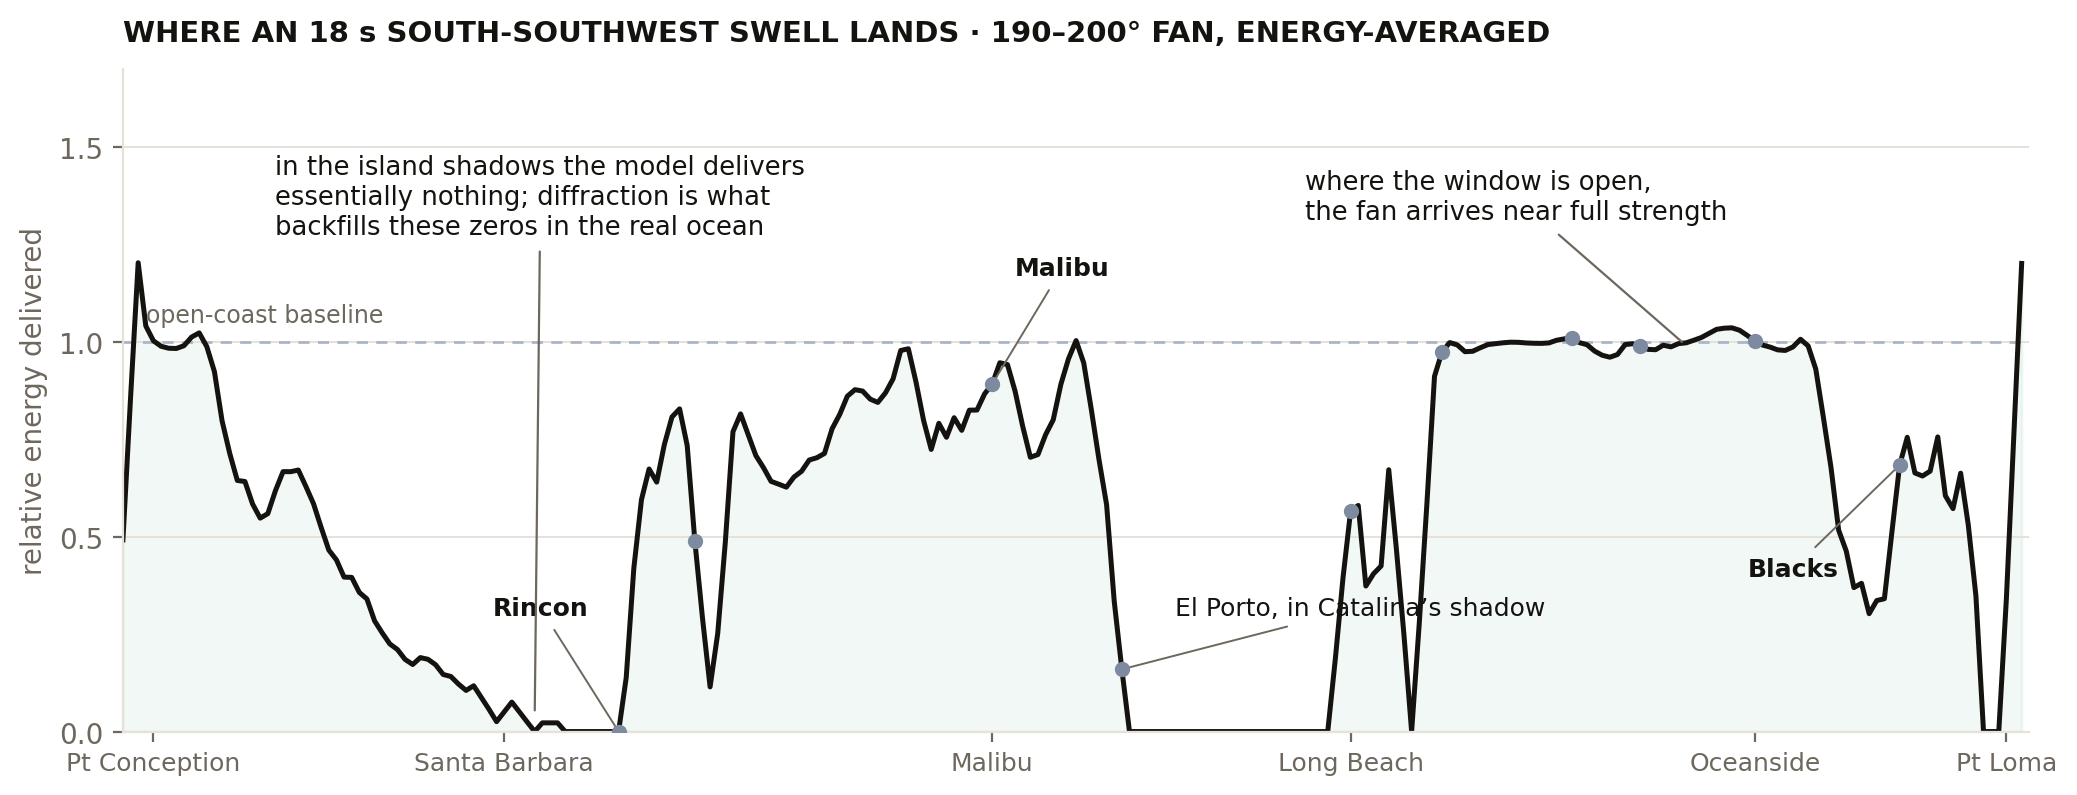
Putting the whole coastline on one line, the first order picture and the second order corrections snap together. Let’s trace a realistic 18 second swell from the SSW, a fan spread across 190 to 200 degrees rather than a single bearing, and log the energy the rays deliver along the shore, scored against an open-coast baseline: 1.0 is what the same swell would hand a straight beach with nothing in the way. Where the windows are open, from Trestles through Oceanside, the fan lands at essentially full strength. Where the islands stand in the way, the model delivers almost nothing: the Santa Barbara and Rincon stretch reads near zero, and Catalina drops a second hole over Santa Monica Bay. Those zeros are the point. The real ocean is never that dark, and the reason is the leak from the previous section: diffraction backfills the shadows the ray model leaves empty. The gap between this curve and what the buoys record on a real south swell is diffraction.
The winter mystery resolves the same way, piece by piece. The fan does the first part of the work: a west-northwest storm’s southern flank reaches the slivers the windows leave open near 263 to 285 degrees. Diffraction picks up the second part, feathering energy past the island edges into the lees. Refraction does the last, turning what survives toward the beach as it crosses the shelf. None of these paths exist in the straight-line picture but are important to consider for realistic modeling.
As fun as this project is, I need to share a word on what the explorer is not. It is geometry, not a forecast: it does not tell you what will be working today, tomorrow, or any specific time. The ten breaks are measured from the sand while the coast-wide curve is measured from a standard three kilometers out, the traced ray paths start just offshore so the last stretch to the beach is not modeled, diffraction is not drawn (the windows are not as stark as they seem here), and the energy numbers are relative to an open-coast baseline, not wave heights. We are also completely ignoring currents, which do affect waves. When it disagrees with the buoy, trust the buoy: that is the current wave state. Note: I am not saying the models derived from the buoys, I am saying the buoys themselves. The windows, though, are just geography, and geography does not update: explore your break’s window →
To end this on a concrete note, the sharpest version of all of this is two south swells in the same stretch of summer. One born off New Zealand and one born off South America both showing up out of roughly the south, but the few degrees between their approach angles decide your surf. One threads the gaps and lights up the western channel while the other lands almost wholly in the islands’ shadow, shut out from the west end before it reaches the coast. What gets through is set by where the swell was born.
This is the first post of our First Order series. Since tools will accompany each of these, they will be sporadic and only written when complete. All tools are free and open-source with the goal of providing resources for the curious surfer. I hope you have explored and enjoyed the tools. Check it against your favorite forecasting platform next time and let me know how it does.
Further Reading: